How to Allocate Resources Across Projects (Methods, Matrix, and Template)
Resource allocation is how a team decides where capacity goes. It is Wednesday morning. The senior designer can take five more hours, the lead developer is already at 110 percent, and a new client has just confirmed a project that needed a start date last Monday. The team has the people. The question allocation answers is which of those people work on what, this week, this month, and at what priority.
This guide covers what resource allocation actually is and how it differs from capacity planning. It walks through the six-step weekly process, the methods, how to build the matrix, and the common pitfalls. The closing section covers what good allocation looks like inside an agency operating model.
What is resource allocation?
Resource allocation is the practice of assigning available people, hours, and budget to specific projects or tasks, in priority order, against a defined time horizon. It is the decision layer that turns capacity into action. Capacity planning answers "do we have enough?"; resource allocation answers "where should it go?" Two different questions, two different artifacts, one feeds the other.
The output of resource allocation is the allocation matrix: a grid showing who is working on what, for how many hours, in a given period. The matrix is the standing artifact of the discipline. Update it weekly and the team has a shared view of where the work sits; skip the update and allocation drifts back into ad-hoc requests and over-promised deadlines.
Resource allocation matrix
Edit cells with the +/- toggles. Rows turn red when someone is over-allocated, yellow when under-used. Project columns flag mismatches between allocated hours and demand.
Edit any cell in the matrix above to see how allocation reshapes when one person is over-loaded or a project is short on hours. The rest of this guide covers the process, the methods, and the pitfalls that turn allocation from a discipline into wallpaper.
What we recommend
At Rock we run resource allocation at two cadences. Weekly at the role level: who is working on what this week, where is the bottleneck, where is the slack. Daily at the project level inside the team workspace: assignees on tasks, hours on cards, capacity visible without a separate tool. The matrix lives next to the work, not in a parallel spreadsheet, and the weekly review is a 15-minute standing meeting tied to the matrix.
The single most useful discipline is starting allocation from the bottleneck role. Most agencies have one role that gates everything: the senior designer, the lead developer, the head of strategy. Allocate that role first, then fit the rest of the team around it. Allocation in aggregate hides bottlenecks; allocation that names the bottleneck makes the constraint visible early.
"An hour lost at a bottleneck is an hour out of the entire system. An hour saved at a non-bottleneck is worthless." - Eli Goldratt, The Goal
Goldratt's frame is the cleanest argument for bottleneck-first allocation. The team that allocates around the constraint compounds; the team that allocates evenly across all roles drowns the constraint and starves the rest. The matrix is the place this discipline shows up; the bottleneck role gets the first hours, the rest gets what is left.
The 6-step resource allocation process
The process below is a weekly cycle. Smaller teams can run it in 30 minutes; larger teams take an hour. Either way the cadence matters more than the duration: a weekly 30-minute review beats a quarterly two-hour deep dive every time.

- Define the scope and time horizon Decide what you are allocating against. A single project sprint, a quarter of work across all clients, a single month for a retainer? Allocation without a defined horizon turns into a permanent re-arrangement. Most agencies allocate weekly with a four-week visible horizon and a quarterly view for forecasting.
- List the resources People, hours, budget, and any specialized tooling. For each person, name their available hours per week (after the non-billable tax). Capacity calculations live in the capacity-planning step; allocation inherits the number from there. Listing fewer resources than you actually have is the most common cause of perpetual over-allocation.
- Check capacity first Before assigning anyone to anything, confirm the capacity numbers from your capacity-planning exercise are still current. Allocations made against stale capacity numbers produce promises the team cannot keep. Update once a quarter at minimum, or whenever the team composition changes.
- Assign by priority, not by availability The highest-value work gets the best person, not the next available person. Most teams reverse this and end up with senior people on routine work and juniors on stretch assignments. Run priority through a simple lens: revenue impact, strategic value, or client retention risk, then assign accordingly.
- Resolve conflicts explicitly Two projects need the same person at the same time. This is not an exception, this is the work of allocation. The decision rule should live in the matrix: priority project gets the hours, lower-priority project either waits, gets a substitute, or gets cut. Avoiding the decision is how scope creeps quietly across the whole team.
- Review weekly, retro quarterly Allocation that is not reviewed becomes wallpaper. A 15-minute weekly review with the matrix open catches the drift before it costs anyone a weekend. The quarterly retro looks at where allocations consistently exceeded plan and asks why; that is where capacity calculations get updated for the next cycle.
The biggest of the six steps is the fourth: assigning by priority, not by availability. Most teams default to "who is free?" and end up with senior people on routine work. The team that compounds asks "who is best?" and accepts that the answer is sometimes "wait." RACI is useful here for naming who is responsible per project, especially when allocation crosses functional boundaries.
Resource allocation methods compared
Several methods exist, each suited to a different work pattern. Most agencies use two or three in combination rather than picking one. The table below summarizes the main methods, what they optimize for, and what to watch out for.
| Method | What it does | Best for | Watch out for |
|---|---|---|---|
| Critical path method | Identifies the longest dependency chain in a project; allocates resources to keep the critical path moving on time | Multi-task projects with hard dependencies | Adds planning overhead; weak fit for retainer or always-on work |
| Resource leveling | Adjusts task start dates so total demand never exceeds available capacity | Teams that hit overload often; projects with flexible deadlines | Pushes deadlines later; commit to it or expect surprises |
| Resource smoothing | Holds the deadline fixed and re-arranges tasks within float to even out demand | Fixed-deadline projects with some scheduling flex | Limited by available float; not always possible |
| Time-purchased | Buys outside capacity (contractors, freelancers) when internal allocation is full | Spike demand without permanent hires | Margin pressure; quality control risk; relationship overhead |
| Predictive scheduling | Uses historical project data to forecast resource demand and pre-allocate accordingly | Mature teams with several seasons of data | Garbage in, garbage out; needs clean time-tracking |
| Priority-based allocation | Ranks projects by priority and allocates the best people to the top of the list first | Agencies with mixed retainer and project work | Demands a real priority decision; punts when leadership avoids the call |
The pragmatic call for most agencies: priority-based allocation as the day-to-day method, with resource leveling triggered when the team hits overload, and time-purchased (contractors, freelancers) for predictable spike demand. Critical path adds value on multi-task projects with hard dependencies but adds planning overhead that retainer work rarely justifies.
How to build the allocation matrix
The allocation matrix is the artifact that makes the discipline visible. It does not need to be sophisticated; a clean spreadsheet works. What matters is the structure, who maintains it, and how often it gets updated.
| Component | What it shows | Why it matters |
|---|---|---|
| Rows: people | Each team member with weekly capacity (e.g. 32 billable hours) | Capacity is the upper bound; a row that exceeds it is the warning sign |
| Columns: projects or weeks | Active projects (or upcoming weeks) the team is allocating against | Forces the work to be visible by name, not by abstract "work" |
| Cells: hours | The number of hours each person spends on each project | The actual allocation decision; everything else is structure around this number |
| Row totals | Sum of hours per person; compared against capacity | Surfaces over-allocation immediately; the most-watched cell of the matrix |
| Column totals | Sum of hours per project; compared against demand | Surfaces understaffed projects before deadlines slip |
| Priority labels | P1/P2/P3 or strategic ranking on each project column | Settles allocation conflicts when demand exceeds capacity |
| RACI overlay | Optional layer naming who is responsible, accountable, consulted, informed per project | Helpful when allocation crosses functional boundaries |
The cells of the matrix are where allocation lives, but the row and column totals are where the diagnostic value is. A row that exceeds capacity is the warning to redistribute or descope. A column that falls below demand is the warning a project is heading for missed dates. Most allocation conversations start at one of these two boundaries.
"If your utilization is less than 60%, you're crawling. Focus on getting paid for the time you're already spending and then you'll be walking." - David C. Baker, Punctuation
Baker's frame is the right calibration for agencies. Allocation that delivers 50 percent utilization is too much slack. Allocation that delivers 95 percent utilization is over-allocated; it ignores the non-billable tax that always comes back. The healthy band sits between 65 and 80 percent, which is the same band capacity planning uses for the calculation upstream.
The data behind nimble allocation
Resource allocation is one of the most underrated levers in business performance. McKinsey research on capital reallocation across S&P 500 companies (1990 to 2013) found a striking gap. Companies in the top third of reallocators delivered 10.8 percent annual returns to shareholders, compared to 2.5 percent for the bottom third. The pattern was consistent across industries.
The same research found that a third of companies reallocate only 1 percent of their capital from year to year, while the most dynamic companies move closer to 8 percent. Inertia in resource allocation is the default; nimbleness is rare and disproportionately rewarded. The matrix above is the operating-level version of the same lever: teams that revisit allocation weekly compound, teams that set allocation once a quarter atrophy.
"The manager as resource allocator decides who gets what. The most important resource the manager allocates is his or her own time." - Henry Mintzberg, professor of management studies, McGill University
Mintzberg's framework identified resource allocator as one of the ten core managerial roles. The point that gets quoted least and matters most is his observation that the manager's own time is the resource being allocated through every "yes" and every "no." Allocation discipline is leadership discipline; the matrix is the artifact that makes both visible.
Common pitfalls
The mistakes below show up across teams that intend to run real allocation and slowly drift back to ad-hoc requests. Most are pattern-recognition failures, not analytical ones.
- Allocating against capacity, not against the bottleneck Most agencies have one role that gates everything: senior designer, lead developer, head of strategy. Allocate the team in aggregate and the bottleneck still drowns. Find the bottleneck role first, allocate it last, then fit everyone else around it. An hour lost at the bottleneck is an hour lost for the whole shop.
- Ghost projects on the matrix Internal initiatives, sales support, "small favors" for past clients, hiring panels. They never appear on the matrix because nobody is billing them, but they consume real hours. Either name them as projects with allocated hours, or accept the matrix is a fiction.
- Tetris-fitting low-priority work into spare capacity A team member has six hours free this week. The instinct is to fill those six hours with whatever is queued. The team that compounds keeps some slack for rework, urgent client requests, and learning. Filling every cell every week looks productive and burns the team out by month three.
- No buffer for rework or revisions Allocating 100 percent of capacity to forward work assumes nothing comes back. Client revisions, internal QA loops, and reactive support always do. Bake a 10 to 20 percent buffer into the matrix or the buffer happens anyway as overtime.
- Updating the matrix less often than the work changes Allocation drift is the slow killer. A matrix updated monthly when projects shift weekly stops describing reality. Either tighten the cadence to weekly, or accept the matrix is for forecasting only and stop using it for real-time decisions.
The biggest of the five is the first one. Allocating against aggregate capacity ignores the bottleneck role; the bottleneck drowns while the rest of the team has slack. Find the bottleneck role first, allocate it last, and run the matrix around it. Agency KPIs will surface the bottleneck eventually as utilization deviates between roles, but the matrix surfaces it weekly.
What this looks like on Rock
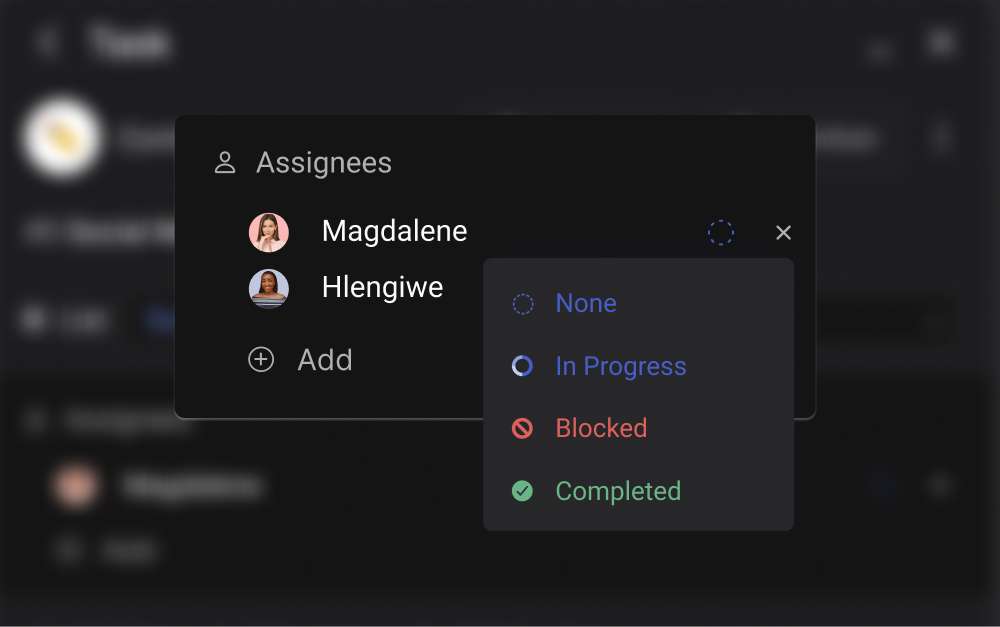
At Rock the allocation matrix lives as a board inside the marketing or operations space. People are assignees on cards, hours are custom fields on each card, and the My Tasks view per person rolls up the weekly total. The matrix is not a separate tool; it is a different view of the work that already exists.

For agencies running multiple clients, the matrix benefits from one extra layer: project priority labels on every card. P1 retainer client work gets allocated first; P2 internal initiatives fill remaining slots; P3 nice-to-haves go to a backlog reviewed monthly. The labels make the priority rule visible to the whole team without anyone needing to remember it.
The broader operating model fits together cleanly. Capacity planning calculates the upper bound on hours; resource allocation distributes them; billable hours ties allocation to revenue economics; marketing operations runs the day-to-day execution underneath. Each piece has a different job; the matrix is what connects allocation decisions to the work the team actually ships.
How to start allocating this quarter
If your current allocation is unmeasured (most teams), do not try to instrument every project and every person in the first week. Pick the simplest version that gives you visibility, then improve from there.
Three moves to start this week. List the team and current capacity per person, sourced from your capacity-planning exercise. List the active projects with weekly hour demand for each. Build a simple matrix (people on rows, projects on columns, hours in cells) and review it weekly. The other discipline (methods, priority labels, RACI overlays) fills in over the first month.
Run the allocation matrix where the team works. Rock combines chat, tasks, and notes in one workspace. One flat price, unlimited users. Get started for free.


