By clicking Accept, you agree to the storing of cookies on your device to enhance site navigation, analyze site usage, and assist in our marketing efforts. View our Privacy Policy or manage preferences.
Oops! Something went wrong while submitting the form.
or continue with
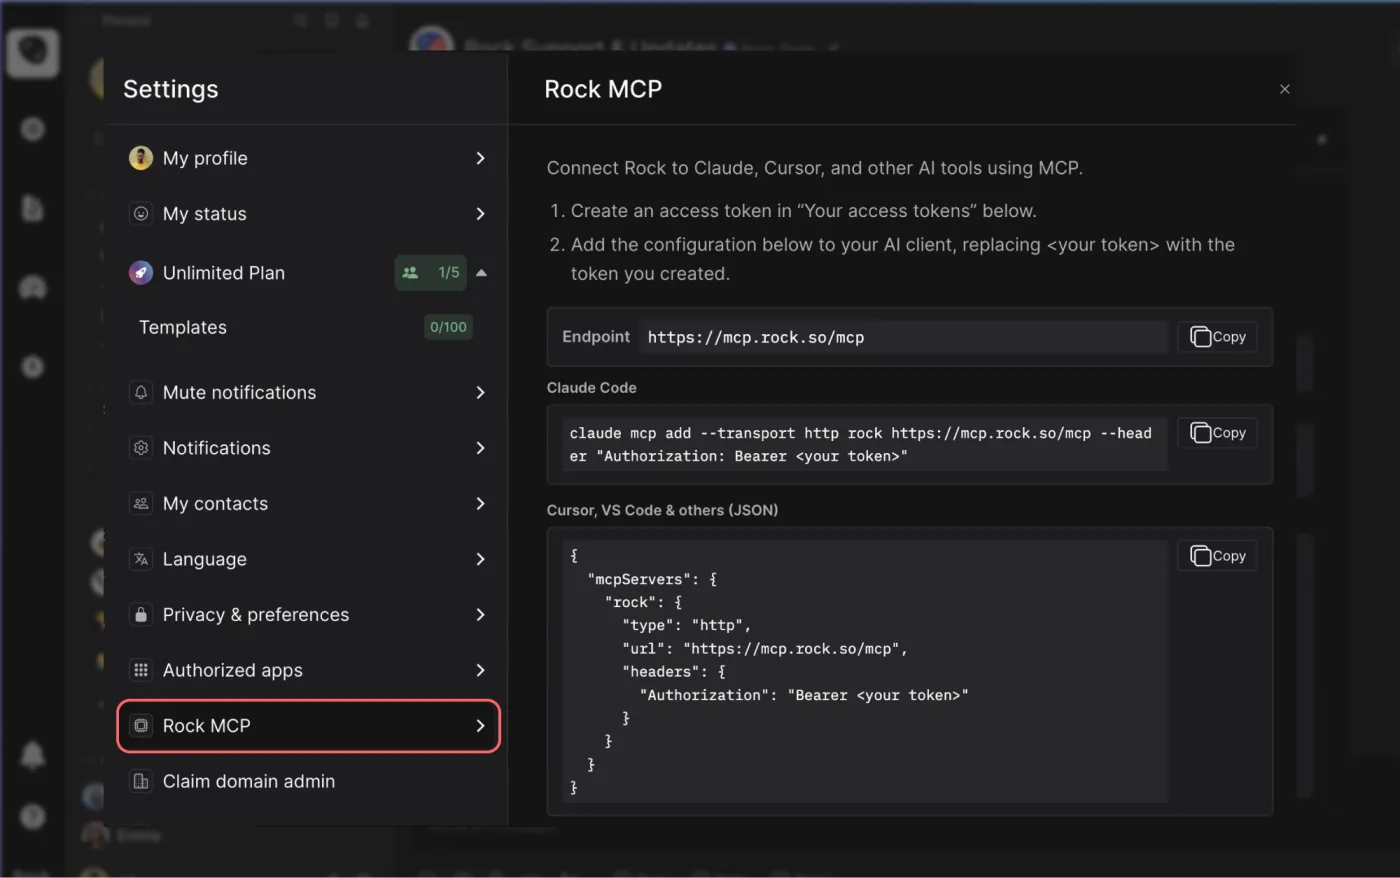
Rock MCP is here. You can now connect Rock to the AI tools you already use. Create a token in Rock, paste it into Claude, Cursor, or another client, and the assistant works inside your spaces as you, across all of them at once.
From earlier calls this month we learned that a lot of our active teams live in tools like Claude and Cursor now, and you would rather they reach into Rock than have you copy things back and forth. We work the same way.
Rock MCP is that connection: your AI assistant reads and updates your spaces directly, making it easier to stay up to date and manage projects across team members.
A few things worth knowing:
It works today with Claude Desktop, Claude Code, Codex, Cursor, VS Code, and Claude Cowork. A one-click connector for Claude on the web and mobile is coming next.
The token acts as you, read and write, across all your spaces. Treat it like a password, and revoke it any time.
It is on every plan, including Free.
Easiest setup: just ask Cowork
Claude Cowork can help you end-to-end with the setup. Share the prompt below and generate a new token, Claude will guide you through all steps.
Keep your token safe, never share in chat.
zsh
Works in coding environments
Add Rock MCP to Claude Code, Codex, Cursor, VS Code, or right from the terminal.
You will find it under your avatar, in a settings panel called Rock MCP. Full setup for every client is in the help guide.
What we use it for
A few of the things we ask it every day:
Search across your whole account. One question searches tasks, notes, and chat messages in every space you belong to. Try "where did we land on the Q3 pricing change?" or "find the onboarding brief and summarize it."
Turn a transcript or doc into tasks. Paste a meeting transcript or point it at a document, and ask it to create the tasks, with owners, due dates, and descriptions already filled in.
Push updates in. Drop your latest growth numbers, funnel metrics, or a status note straight into the right space, so the team sees it where they already work.
Run your to-do list from the chat. Ask "what is my most urgent task?", work on it together, then mark it done or update it without opening the app.
Plus, recent fixes
Since our last update, we also shipped:
Cleaner notifications and unread counts. Unread dots clear correctly for archived spaces and after "Mark all as read," and counts update the moment you open an item.
DMs in custom folders no longer disappear from your sidebar.
Chat threads stay in the right space now, with no more cross-space mix-up when you open one.
Add Spaces picker now targets the correct workspace inside embeds.
T-shirt sizing is an agile estimation technique where the team sizes work using XS, S, M, L, and XL instead of hours or story points. It is the fastest way to get rough estimates on a backlog because everyone already knows the difference between a small and an extra large. Most teams use it for roadmap conversations, release planning, and the early stages of backlog grooming.
The method is honest about being a rough cut. It refuses to give a number that someone will later treat as a commitment. This guide walks through how t-shirt sizing actually works and when it beats story points. It also covers the pitfalls most explainers skip and a practical pattern for client-facing roadmaps.
Quick answer: what t-shirt sizing is
T-shirt sizing assigns work to one of five buckets: XS, S, M, L, and XL. Teams discuss each story for one to two minutes, agree on a size, and move on. The sizes are relative. An L is larger than an M but smaller than an XL. The team learns what those sizes mean for their own work over time. There is no fixed conversion to hours.
The technique is meant for moments when detail is thin and the goal is direction, not exact dates. Roadmaps, quarterly plans, early user-story sweeps, and pricing conversations with clients all fit. Sprint-level estimation, where the team needs precise capacity numbers, is usually a worse fit. T-shirt sizing tells you a story is roughly twice another story, not that it will close in 14 hours.
Try a sizing session, live
The board below holds five stories of varying scope. Drag each one into the size that fits. Toggle Story points to see a Fibonacci conversion and a running capacity total. Toggle Planning Poker mode to hide the sizes after you drop them, so a team can simulate a blind estimation round, then click Reveal.
Size your backlog
Drag each story into the size that fits. Add your own stories with the + button. Set a sprint capacity to see when you go over.
points (optional)
0 of 5 sized0 pts no target
Drag a card from Unsized into XS, S, M, L, or XL. Use + Add to add your own.
Tap a card, then tap a column header
That is exactly how a sizing session feels. Run yours with the team in Rock and keep the stories in one place.Try Rock free
Two things stand out once you have used the board. First, sizing five stories takes under a minute. Second, the moment Story points is on, the room starts asking, "is L really 5 points?" That conversation is the point. Sizes are an opening move; the team's own data tells you what each size means in the next sprint.
When to use it, when not to
T-shirt sizing earns its keep in four places. Roadmaps over a quarter or longer, where the work is too vague for point estimates. Release planning, where the goal is to fit work into a release rather than commit to a sprint. Early backlog grooming, before user stories have acceptance criteria. And client-facing scoping calls, where the buyer needs a shape, not a quote.
It fails in three places. Sprint-level commitments, where the team needs to know if 40 points fits in two weeks. A bag of L sizes does not give that answer. Velocity tracking, where the team is benchmarking output across sprints and needs additive numbers. And reporting to non-technical executives who treat L as "around three weeks" and then anchor a release date on it. In the last case, the size becomes the commitment, which defeats the purpose.
Vasco Duarte started the #NoEstimates movement in 2012. He reported that when his team replaced every story-point value with "1," the forecast changed by only 8 percent. That is the warning behind any estimation method. If the team is using sizes to feel certain about a date, the sizes are not the problem. The certainty is.
T-shirt sizing vs story points vs Planning Poker
Four methods compete for the same job. The honest choice depends on what the team needs the estimate to do.
Method
How it works
Best for
Watch out for
T-shirt sizing
Five buckets (XS to XL). The team agrees on a size per story in seconds.
Roadmaps, release plans, early grooming, client scoping calls.
Not additive. Cannot be summed into a capacity number without conversion.
Sprint-level commitments, velocity tracking, mature teams with baseline data.
Drift over time. A 3 today is not always a 3 next quarter.
Planning Poker
Each team member picks a value privately, then everyone reveals together.
Junior-heavy teams, any team where anchoring is a problem.
Slower. Takes 3-5 minutes per story instead of one.
Ideal days
Estimate in days of focused work assuming no interruptions.
Teams new to agile coming from waterfall, fixed-bid work.
Clients and managers treat ideal days as calendar days, which they are not.
Mike Cohn, who literally wrote the book on agile estimating, puts the trade-off plainly. He calls t-shirt sizes "an OK approach to getting started with relative estimating" but warns of two severe weaknesses. They are not additive. You cannot tell a boss you will be done in three mediums, four larges, and two petites. And your view of an XL may not match mine. You may think it is 50 percent bigger than an L; I may think 25 percent. His recommendation: start with t-shirt sizes if it is easier, but put numbers under them. Use M = 5 and L = 8 as a starting map, then gradually shift to the numbers directly.
Planning Poker, invented by James Grenning in 2002 during a stalled XP planning meeting, layers on top of any of the others. The mechanism is the private vote, not the number system. Pair Planning Poker with t-shirt sizing for a team where the senior voice tends to set the size before the juniors speak. Pair it with story points for a team that is already comfortable with numbers but is anchoring on a familiar story.
Run sizing in the same place the team chats.
Rock pairs chat with a task board, so the sizing call, the stories, and the follow-up live in one space. One flat price, unlimited users.
The session works best as a 45-minute meeting with the team that will do the work. The product owner or account lead brings a list of stories. The team brings recent context. The five steps below cover the shape of a good session.
Anchor with a reference storyPick one small story everyone agrees on and call it an S. Every other size in the session is relative to that anchor. Skip this step and the first story you size becomes the accidental reference, which is usually too large.
Walk through one story at a timeThe product owner reads the story and any acceptance criteria. The team has two minutes to ask questions. Then everyone calls a size at once, or drops their card on the board in Planning Poker mode.
Discuss outliersIf estimates span more than two sizes (an S and an L on the same story), pause and let the highest and lowest voices explain. The conversation is the value. The second vote is almost always tighter, and the team learns where its hidden assumptions live.
Re-size after the discussion, not beforeAvoid the trap of letting the loudest voice update the size before the second vote. The point of the vote is to surface the disagreement. Average the room only after every voice has been heard.
Convert to capacity at the end, not duringOnce every story has a size, map the sizes to story points (S = 2, M = 3, L = 5, XL = 8 is a common starting set) and sum the points. This is the moment to compare against the team's velocity from the last few sprints.
Janaka Fernando is a product owner who has written about running sizing sessions with engineering teams. He makes the practical observation that the time savings come from the constraint. In his words, participants have to pick from a fixed set of sizes rather than guessing exact hours. The five buckets force a decision in seconds. An hours estimate invites a five-minute calculation.
T-shirt sizing for agency client roadmaps
Agencies hit a wall with story points the moment a client sees them. A non-technical buyer hears "13 points" and either pretends to understand or asks what a point is. The conversation goes sideways. T-shirt sizes survive that handoff because everyone has worn a shirt. Telling a client that their Q3 roadmap has two XLs, three Ls, and six Ms gives them a shape to react to. No tutorial needed.
The pattern that holds up across agency work: use t-shirt sizes for any artifact a client will see. Use story points internally once the work breaks down into a sprint backlog. The two systems do not need to be reconciled in public. They need to map to each other once, inside the team, so L stories on the roadmap become 5-point stories on the sprint board.
Anchor calendar expectations carefully. An L might be one to two weeks of work for a 5-person team; an XL might be two to four weeks. Say that out loud to the client. Otherwise they will quietly translate L into "I will have it next Friday" and the next conversation gets adversarial. Putting a calendar band against each size on the roadmap kills 80 percent of those conversations before they start. The caveat: scope changes shift the band.
The last pattern: retainer scoping. When a new client asks what their monthly retainer buys, t-shirt sizing answers the question without a long discovery. A typical retainer with us closes 1 XL, 2 Ls, and 3 Ms a month. That sentence is enough for the buyer to push back on the mix. If they want a second XL, they trade for two Ms. The conversation is concrete because the units are familiar.
Common pitfalls
Most teams stub their toe on the same six things. Knowing the failure modes ahead of time is most of the fix.
Anchoring on the first cardThe team sizes the first story as M without discussion, and every other story becomes relative to that arbitrary M. Always anchor with a small reference story the team agrees on, not the first item on the list.
Sizing without acceptance criteriaAn "add a search bar" story is an S without edge cases and an XL once you account for filters, sort order, and empty states. Force the team to name the acceptance criteria before sizing, even at one bullet.
The loudest voice winsJunior team members match the senior estimate because they do not want to disagree in public. Planning Poker mode is the fix. Hide the sizes until everyone has dropped a card.
Premature conversion to hoursThe team sizes a story as L, then immediately translates it into "about 20 hours." The relative-estimation benefit evaporates and the team is back to estimating in hours with extra steps. Convert at the end of the session, not during.
Mid-sprint re-sizingTwo days into the sprint, the team decides a story was actually an XL instead of an L. Resist. The sprint already started; logging the mistake for the next planning is more useful than re-sizing now. Re-sizing thrash kills the visibility benefit of the burndown.
Collapsing to S, M, L onlyTeams drop XS and XL because they feel rare, then everything piles into M. Granularity dies. Keep all five buckets and force the conversation when nothing lands in XS.
What we recommend at Rock
Rock is not a dedicated agile tool, but most of our customers run sizing sessions inside the same workspace they use for chat. The pattern that compounds is small: keep the stories, the sizing call, and the follow-up conversations in one space. A sizing session in a separate tool that nobody opens between sprints loses 80 percent of its value to context switching.
Practical setup. Each sprint or quarter has a Rock space. The task board holds the stories with the t-shirt size in the description. Prefix the size with a single letter (S, M, L, XL) so the board sorts cleanly. The sizing call happens as a scheduled meeting with the agenda posted in the space chat. Outcomes are logged as task updates in the same space. Anyone joining the project a week later sees the sizing decisions next to the work.
For agency teams working across multiple clients, each client gets a space, and the t-shirt convention stays identical across spaces. A project lead moving between three client spaces reads the same shorthand everywhere. Consistency in the sizing language matters more than the choice between t-shirt sizes and story points. The team's brain stops translating, and the conversations get faster.
When picking between methods, default to t-shirt sizing for any artifact a client touches. Move to story points internally once the team has three or four sprints of velocity data to anchor against. Use Planning Poker any time the team has a juniors-and-seniors mix, regardless of which sizing scheme sits underneath.
Frequently asked questions
Is XL bigger than 13 story points?
There is no fixed conversion. A common starting map is XS=1, S=2, M=3, L=5, XL=8, which puts XL below 13 points. Teams that work on large epics often add XXL=13 or split anything that feels like a 13 into smaller stories before the sprint.
Can you use t-shirt sizing and story points together?
Yes, and most agency teams should. Use t-shirt sizes for roadmaps and client conversations, then convert to story points for sprint commitments. The mapping needs to be agreed once and then stay stable, otherwise the velocity numbers drift across sprints.
How do you convert t-shirt sizes to days?
Do not convert directly. Convert to story points first, then apply the team's velocity to get a sprint count, then translate sprints into calendar weeks. Direct size-to-days conversion turns the sizes into commitments and defeats the purpose of relative estimation.
When should you not use t-shirt sizing?
Skip it for sprint-level commitments where the team needs precise capacity. Skip it when a non-technical stakeholder will treat sizes as fixed delivery dates. Skip it for fixed-bid client work where the contract requires hour estimates. Stick with t-shirt sizes for vague work, roadmaps, and early-stage scoping.
T-shirt sizing or Planning Poker, which is better?
They solve different problems. T-shirt sizing is a sizing scheme. Planning Poker is a voting method that can use any scheme, including t-shirt sizes. Pair them when the team has anchoring problems or a senior-junior dynamic that biases first-vote estimates.
How long should a t-shirt sizing session take?
A 45-minute meeting handles 15 to 25 stories comfortably. If the team needs longer per story, the stories are too vague and need acceptance criteria before sizing. If the team finishes in 10 minutes, the sizes are probably not being discussed enough.
T-shirt sizing is the right opening move for any team that needs estimates fast and is honest about not knowing exact dates yet. It is not the right closing move when the team needs commitments inside a sprint. Use it where the work is vague and the audience is broad. Switch to story points and a real velocity baseline once the team is committing to specific work in specific weeks. Both methods belong in an agile team's toolkit. A sizing session that picks the right one for the moment beats any single-method shop.
Cycle time is the clock that runs while a single work item is being worked on. Start it when the item enters "in progress" and stop it when the item is done. The number you get is the cycle time for that item. Average a few weeks of those numbers and you have a metric you can quote a client, a measurement you can defend in a stand-up, and the only honest answer to "how long does work like this usually take?"
The problem is that four different camps define cycle time four different ways, and most teams pick up the wrong one for their context. Lean manufacturing measures it per unit produced. Kanban software measures it per item on a board. DevOps measures it from first commit to production deploy. Generic agile blogs blur the three. This guide reconciles the four definitions, ships with a calculator that does the math, and explains how to set a cycle time SLA that holds up in front of a paying client.
Quick answer: what cycle time is
Cycle time is the elapsed time between the moment a work item starts being actively worked on and the moment it is delivered. For a kanban board, that means the timer starts when the card moves into "In progress" and stops when it moves into "Done." For each item you finish, you get one cycle time number. The cycle time of the team is the distribution of those numbers across a window of weeks, not a single average.
The reason cycle time matters is forecasting. Suppose 85% of design-review items finished in 9 days or fewer over the last six weeks. You can promise a client a 10-day turnaround on similar work with real evidence behind it. Without cycle time, every estimate is a guess.
Calculate your cycle time with Little's Law
Little's Law gives you average cycle time from two inputs you can pull off a board: average work in progress and throughput. The formula is simple. The calculator runs it for you and shows what happens if you cut WIP.
Cycle time calculator (Little's Law)
Enter how many work items the team has in progress, how many it finishes per week, and the target you want to hit. The calculator returns average cycle time and shows what changes if you cut WIP.
Average WIP
Items in progress at any moment.
Throughput / week
Items completed per week, 4 to 6 week average.
Target cycle time (days)
What the team or client expects.
Current average cycle time
21days
Target: 14 days7 days over
Close to target. Look at WIP first.
What if WIP dropped?
-25%
Bar reflects the effect of the WIP cut. Baseline (no cut) is 21 days at WIP 12. The cut saves 5.2 days.
The calculator returns an average. Average is the right starting number when you are sizing a question or running a thought experiment. For client-facing commitments, replace average with a percentile, which the section on cycle time SLAs covers below.
Cycle time starts where the work starts.
Rock pairs chat with a task board, so the moment a card moves into "In progress" is the moment the timer starts. One flat price, unlimited users.
The cycle time confusion is real. Four communities define the metric four different ways, and treating their numbers as interchangeable is the most common source of bad estimates. Pick one definition, write the start and stop points down, and stay with it.
Martin Fowler's bliki post on cycle time makes the same point in different words. He calls it a "slippery" measurement because the start and stop points are not standardized, and he recommends naming them every time the metric is reported. That habit is the whole article in one move.
"Cycle time is one of those words used in lots of different ways, and it's important to be clear which one is meant whenever you encounter it." - Martin Fowler, martinfowler.com
Lean manufacturing definition
In a factory, cycle time is the time it takes to produce one unit. The clock runs while the unit is in the production process, and the number is most useful as an average across many identical units. This is the definition lean.org and Six Sigma references use. It assumes the work is homogeneous and that "one unit" means the same thing each time.
This definition does not translate to knowledge work. A landing page tweak and a brand refresh are not units of the same kind, so averaging the time they took produces a number that means nothing.
Kanban software definition
In kanban, cycle time is the elapsed time between the moment a single item enters the "in progress" column and the moment it leaves the "done" column. The clock runs per item, the number is recorded per item, and the team works with the distribution of those numbers rather than a single average. Daniel Vacanti formalized this approach in Actionable Agile Metrics for Predictability, paired with Little's Law and percentile-based forecasting.
This is the definition that works for agency and software teams. Per-item measurement handles heterogeneous work, the distribution surfaces variation honestly, and the math links cycle time, WIP, and throughput in a way the team can act on.
DevOps and DORA definition
The DORA research group, led by Nicole Forsgren, defines cycle time as the elapsed time from first commit on a feature to that feature reaching production. This is sometimes called "lead time for changes" inside DORA literature, which adds another layer of confusion. The DORA definition is the right one if the question is "how fast does our engineering team ship code." It is the wrong one if the question is "how fast does our team finish design tasks," because design work happens before any commit.
Generic agile definition
Most agile blogs use a vague version of the kanban definition without naming the start and stop points. "From work start to delivery" sounds clear until two team members disagree about when work "started." Was it the moment the ticket was created, the moment it was assigned, the moment the first line of code was written, or the moment it left the backlog? Each option gives a different number.
The fix is the Fowler rule: pick a start point, pick a stop point, and write both down on the team's wiki. After that, the conversation about cycle time is a conversation about the same number.
The cycle time formula and how to calculate it
There are two formulas worth knowing. One is Little's Law, which works for averages and is the math behind the calculator above. The other is the per-item formula, which works for percentile forecasting and is what you should report to clients.
Little's Law (for averages):
Average cycle time = Average WIP / Average throughput
If the team has 12 items in progress on average and finishes 4 items per week on average, average cycle time is 12 / 4 = 3 weeks, or 21 days. The same formula in reverse tells you the WIP you need to hit a target cycle time at a given throughput. Want 10-day cycle time at 4 items per week throughput? Carry no more than 5.7 items in progress at any moment.
Per-item formula (for percentiles):
Item cycle time = timestamp(done) - timestamp(in progress)
Record one number per item across at least four weeks. Plot the numbers on a histogram. The shape almost always has a long right tail. Pull the value at the 50th percentile (the median), the 85th percentile, and the 95th percentile. Those three numbers are the team's cycle time. The single average is a summary that hides the tail and burns the team when a client asks for a guarantee.
Four to six weeks of data is the typical minimum sample. Less than that and the percentiles move too much from one item to the next. More than three months and the data starts including team and process changes that no longer reflect today. Many teams pair cycle time tracking with sprint backlog reviews to spot the trend early.
Cycle time vs lead time
Lead time and cycle time are the metrics most often confused, partly because manufacturing, kanban, and DORA each define them slightly differently. The kanban definition is the one to use for service work.
Lead time is the elapsed time between the moment a customer makes a request and the moment they receive the delivery. The clock starts at request and stops at delivery. This is the number the client cares about, because it reflects their experience of waiting.
Cycle time is the elapsed time the team is actively working on the request. The clock starts when the item enters "in progress" and stops at delivery. This is the number the team can control, because it excludes the waiting period before work began.
Lead time is always greater than or equal to cycle time. The gap between them is queue time, which sits in the backlog. A team with a 5-day cycle time and a 20-day lead time has a queue problem, not a delivery problem. The fix is intake management, not faster execution. A team with a 5-day cycle time and a 6-day lead time has the inverse problem. The backlog is near empty and there is not enough work in queue to keep the team busy.
Don Reinertsen's Principles of Product Development Flow drives this point home. Cycle time is a dependent variable that follows from WIP and throughput. The independent variables, the ones you can actually move, are how much work you let in and how much capacity you have. Lengthening lead time on the front end often shortens cycle time on the back end. Taking longer to accept work cuts context switching, and the net experience for the client improves.
Cycle time vs takt time
Takt time is borrowed from lean manufacturing and rarely applies to service work, but the comparison keeps coming up in articles, so it earns a section.
Takt time is the pace of customer demand. If customers buy 80 units per 8-hour day, takt time is 6 minutes per unit. Production is balanced when one unit comes off the line every 6 minutes, no faster and no slower. Takt is a planning input, not a measurement output. It tells the team how fast they need to be, not how fast they are.
The reason takt does not translate cleanly to service work is that service demand is rarely steady or homogeneous. An agency might get one brand refresh request a quarter and twenty landing page tweaks a week. Computing a takt time across those would produce a meaningless number. Where takt occasionally applies in service work is at narrow process steps: how often does a content review need to clear the queue, given the inflow rate? That kind of constrained question is a valid use. "What is the agency's takt time?" is not.
Practical guidance: if a stakeholder asks for takt time and the team does service work, ask back what decision the number is supposed to inform. Most of the time, the question is really about throughput capacity, which is a different metric.
Cycle time vs throughput
This is the comparison most articles skip, even though it is the most useful pair for forecasting. Cycle time and throughput are two sides of the same flow. They are linked by Little's Law and they move together.
Throughput is the number of items the team finishes per unit of time. Items per week is the most common unit for software and agency work. Throughput is measured at the right edge of the board, not by counting active work.
The relationship matters because clients ask different questions of the same data. "When will this specific item be done?" is a cycle time question, and the answer is the 85th percentile of past items. "How many items can we get through this quarter?" is a throughput question, and the answer is the median weekly throughput multiplied by the number of weeks. Both numbers come from the same board export, but they answer different questions and surface different decisions.
The four-metric comparison below settles the differences in one view. Print it and stick it on the wall.
Metric
What it measures
Clock starts
Clock stops
Common mistake
Cycle time
Active work duration per item
Item enters "in progress"
Item done
Averaging across mixed sizes instead of using percentiles
Lead time
Total customer wait
Request made
Delivered
Reporting it as cycle time and hiding queue problems
Takt time
Pace of customer demand
Not applicable
Not applicable
Treating it as a measured number instead of a planning input
Throughput
Items finished per period
Period start
Period end
Confusing with velocity (story points, not items)
What "good" cycle time looks like for service work
There is no universal benchmark for cycle time. A bug fix should clear in hours; a brand strategy engagement should clear in months. What "good" looks like is a function of the work type, the team's cadence, and the client's expectation. The honest answer is that the team's last six weeks of cycle time data is the only benchmark that matters.
That said, three rules hold across most agency and product teams.
Use the 85th percentile, not the average. Daniel Vacanti's argument for percentile-based forecasting comes down to this: an average tells the client when half the items will be done. The other half take longer, sometimes much longer. An 85th percentile commitment means 17 out of 20 items will hit the date. That is the conversation a client actually wants to have. His books and the ProKanban resources lay out the math in detail.
"An average cycle time tells you almost nothing about how long any single piece of work will take. The variation around the average is where every interesting forecasting question lives." - Daniel Vacanti, paraphrased from Actionable Agile Metrics for Predictability
Track cycle time by work type, not in a single bucket. Design review, copy edit, and dev build are different work. Their cycle time distributions are different. Combining them into one number produces a percentile that is too wide for design work and too tight for dev. Tag items by type before measuring, and report cycle time per type.
Watch the trend more than the absolute number. A team whose 85th-percentile cycle time fell from 14 days to 9 days over a quarter is more useful to a client than a team holding a steady 12 days. The trend communicates that the team is learning. The absolute number, on its own, communicates only that the team finished some work.
Five steps to set a cycle time SLA
An SLA is a client-facing promise: "Items of type X are delivered within Y days." Setting one is straightforward once the team has cycle time data and has picked the kanban definition. The trap is committing to a number before the data exists.
Define the start and stop pointsPick the column on the board where the timer starts and the column where it stops. Write both on the team wiki. The most common choice is "in progress" to "done," but "ready for review" to "shipped" is also valid for some teams. Whatever you pick, do not change it once data collection starts.
Instrument the boardThe board must record the timestamp when an item enters and leaves each column. Most kanban tools, including Rock, do this automatically through card history. Export the data to a spreadsheet at the end of each week.
Collect four to six weeks of dataTag each completed item by work type before computing anything. Twenty items per type is the minimum that gives a stable percentile; fifty is better. Items that took an unusual path (paused, reopened) belong in a separate column for inspection, not in the SLA calculation.
Compute median, 85th, and 95th percentilesFor each work type, sort the cycle times ascending and pull the values at the 50th, 85th, and 95th percentile. The 85th percentile is what you commit to in the SLA. The 50th is what the team reports internally. The 95th is the worst-case to be transparent about.
Write the SLA and the exceptionsA clear SLA reads: "Design review items are delivered within 9 business days, measured from the moment the item enters review. Items requiring more than two rounds of revision fall outside this commitment." Name the type, the number, the start point, and what is excluded. Revisit the data quarterly and adjust.
Common cycle time pitfalls
Most teams that adopt cycle time measurement bounce off one of a small set of failure modes. The fixes are mechanical, not philosophical.
Reporting the average instead of the percentileAn average cycle time means half the items took longer. Commit to an average and you miss the date on every second engagement. Commit to the 85th percentile and you hit the date on 17 of every 20 items. The math is one column move in the spreadsheet and the credibility difference is enormous.
Mixing work types in a single numberA bug fix and a brand refresh share a board but not a distribution. Mixing them in one cycle time number gives you a percentile too loose to be useful for bugs and too tight to be honest about brand work. Tag work by type before measuring.
Changing the start and stop points mid-quarterA team that quietly redefines "in progress" three weeks into data collection erases the trend they were trying to track. Once the definition is on the wiki, lock it for at least a quarter. If a change is needed, restart the data window from zero.
Ignoring WIP and treating cycle time as the leverCycle time is a dependent variable. The independent variables are WIP and throughput. Teams that try to push cycle time down without lowering WIP end up cutting corners on quality. The Reinertsen rule: move WIP first, watch cycle time follow.
Treating one item as a signalA single item that took twice as long as the previous five is not a trend. It is one item. Forecast and SLA conversations require a window of at least 20 items per work type. Anything less and the team is reacting to noise.
Optimizing the metric instead of the workSplitting tickets into smaller pieces to bring cycle time down is gaming the metric. The board looks healthier; the client still waits the same amount of total time. Watch lead time alongside cycle time to catch this pattern early.
What we recommend at Rock
Rock is not a dedicated kanban tool, but most of our customers run delivery work on the task board inside their space. That gives us a useful vantage point on how cycle time tracking actually plays out in service businesses.
The pattern that works is small. Each work type gets its own column flow on the board: backlog, in progress, in review, done. Cards move left to right and the card history records the timestamps. At the end of each week, the team lead exports the completed cards to a spreadsheet, tags them by type, and updates a rolling six-week view of median and 85th percentile cycle time. The whole exercise takes 20 minutes a week once the habit is in.
The conversation that matters happens at the weekly review. The team looks at the percentile by work type and asks one question: did anything cross the 85th percentile threshold this week, and if so, why? That single question catches scope creep, dependency bottlenecks, and queue problems before they show up in a client escalation. It is the cheapest early-warning system a delivery team can run.
For agency teams running several client backlogs in parallel, each client gets its own Rock space with its own board. The cycle time math runs separately per space because the work types are different per client. Combining clients into one number is a textbook example of the mixing-work-types pitfall.
Cycle time starts when a card moves into "In progress" and stops when it moves into "Done." The board records the timestamps for you.
Free resource: the Agile Sprint Planning template ships with backlog, in-progress, and done columns ready for cycle time tracking.
Frequently asked questions
What is cycle time in simple terms?
Cycle time is the time between when work on a single item starts and when that item is delivered. On a kanban board, the clock starts when the card moves into "in progress" and stops when it moves into "done." Each item produces one cycle time number, and the team works with the distribution of those numbers over a window of weeks.
What is the cycle time formula?
Two formulas matter. For averages, Little's Law gives cycle time = work in progress / throughput. For client commitments, per-item cycle time = timestamp(done) minus timestamp(in progress), reported as the 85th percentile of a window of items, not as an average.
What is the difference between cycle time and lead time?
Lead time measures the full customer wait, from the moment a request is made to the moment it is delivered. Cycle time measures only the active work, from the moment the item enters "in progress" to the moment it is delivered. Lead time minus cycle time is the queue time, which sits in the backlog before work begins.
Is cycle time the same as takt time?
No. Cycle time is a measurement of how long work actually takes. Takt time is a planning input that describes the pace of customer demand. Takt time tells you how fast the team needs to be; cycle time tells you how fast it is.
How do you calculate cycle time on a kanban board?
Record the timestamp when each card enters the "in progress" column and the timestamp when it enters "done." Subtract the two for each card. Collect four to six weeks of items, tag them by work type, and report the median, 85th, and 95th percentile per type. Most kanban tools record the timestamps automatically through card history.
What is a good cycle time for a software team?
There is no universal answer. A bug fix often clears in hours; a feature with backend changes can take weeks. The honest benchmark is the team's own last six weeks of data per work type. The trend matters more than the absolute number: a cycle time falling quarter over quarter signals a team that is learning.
Why use the 85th percentile instead of the average?
An average means half the items took longer. Committing to an average misses the date on every second engagement. Daniel Vacanti's argument in Actionable Agile Metrics is that the 85th percentile gives a commitment that holds for 17 of every 20 items, which is the only kind of forecast a client can use to plan.
Cycle time is one number per item, measured per work type, reported as a percentile across a window of weeks. Get the definition on the wiki, get the data into a spreadsheet, and the rest of the conversation with the client gets easier. Rock combines chat, tasks, and notes in one workspace. One flat price, unlimited users. Get started for free.
A burndown chart is a line graph that shows how much work remains in a sprint or release against time. The chart was invented by Ken Schwaber at Fidelity Investments in 2000 and became the default visibility artifact for Scrum teams. Two lines run across the chart. The ideal line slopes from the total points down to zero. The actual line tracks remaining points at the end of each day.
The artifact has one assumption: scope is fixed. Agencies rarely work with fixed scope. This guide explains how to read a burndown chart and walks through the anti-pattern shapes nobody else covers. It then shows where the chart lies when a client emails a new request on day five.
Quick answer: what a burndown chart is
A burndown chart is a line graph that plots remaining work, measured in story points or hours, against time. The ideal line slopes from the total down to zero across the sprint. The actual line tracks what is really left at the end of each day. The chart is a visibility tool, not a planning tool. The team uses it to spot drift early.
Three variants matter. The sprint burndown covers one sprint and is the most common. The release burndown spans multiple sprints toward a release date. The product burndown looks across the whole product backlog and is the rarest in practice. All three follow the same shape and have the same blind spot.
See it lie: burndown vs burnup, live
The widget below shows a 10-day sprint with 40 story points. Toggle between burndown view and burnup view, then click the red button to add five points of scope on day five. Watch what each chart does. The burndown line stalls and bumps. The burnup chart shows the ceiling rising, which is the conversation the team actually needs to have.
Burndown vs Burnup, live
Set the sprint length and total points. Toggle between burndown and burnup. Click the scope-change button to add work mid-sprint and watch which chart tells the truth.
Burndown viewBurnup view
Sprint length (days)
Total story points
Click the red button to add scope mid-sprint, then toggle the view.
Track the sprint where the team works.
Rock pairs chat with a task board, so the sprint plan, the daily updates, and the scope conversations stay in one space. One flat price, unlimited users.
Two axes, two lines. The x-axis is time, usually in days. The y-axis is remaining work, usually in story points but sometimes in hours. The dashed ideal line is the goal. The solid actual line is reality. Where the two diverge is where the team is drifting.
The art is in reading the gap rather than the absolute numbers. Above the ideal line means work is piling up. Below the ideal line is on track, sometimes too far ahead if the team underestimated. A line that stays flat for several days is a stall, which is usually invisible work or a hidden blocker. A line that cliffs down on the final day means the team marks work done at demo, not when it ships.
Set the y-axis unit before the sprint startsStory points or hours. Pick one and use it for every item in the sprint. Mixing units gives the chart math but breaks the visual comparison. Most agile teams settle on story points because they are relative, not absolute. Teams in early calibration often size in t-shirts first and convert to points after a few sprints of data.
Draw the ideal line from total to zeroTotal points at day zero, zero points at the last day of the sprint. The slope is the team's required burn rate. If your sprint is two weeks and the backlog is 40 points, the team needs to close roughly four points per day to stay on the ideal line.
Update the actual line at the end of each dayThe Scrum master or the developer who closes the last task updates the chart. Daily is the right cadence. Sub-daily is overhead. Weekly is too late because you cannot react inside the same sprint.
Read the gap, not the dotA single day above or below the line means little. Three consecutive days above means the team is committed to too much work, has a hidden blocker, or the estimates were optimistic. That is the signal to act on.
The Scrum Guide 2020 update removed burndown charts as a required artifact. The current guide refers to "trends" without mandating any specific chart. Teams that still use burndown do so by choice, which is the right way to use any visibility tool.
The five anti-pattern shapes
A healthy burndown follows the ideal line, with the actual a few points above or below at any given day. Real burndowns rarely look like that. Five shapes show up over and over, each pointing at a specific failure mode. Pattern-matching them is the fastest way to know what to ask in the next standup.
The Cliff: flat for days, then a sharp drop at the endThe actual line stays high and flat for most of the sprint, then plummets in the last two days. Work was finishing all along but the team only marked items done at the demo. The fix is mid-sprint reviews, not end-of-sprint heroics. Stefan Wolpers calls this the most common shape in his anti-pattern survey.
The Hockey Stick: ideal pace, then a vertical drop on the last dayA close cousin of the Cliff. The team tracks well through day eight, then everything closes on day ten. Usually this means stories are too large to complete inside the sprint, so they sit at 99 percent done. Split the stories smaller, not just into smaller subtasks.
The Wave: line goes up before it goes downThe actual line bumps upward mid-sprint, then resumes its descent. New work was added inside the sprint. The chart shape is the only place anyone notices because the conversation about the scope change happened in chat, not in the planning ceremony.
The Flatline: actual stays parallel to the startNothing burns down. The team is busy, the standup is full of updates, but no item meets the definition of done. Usually a single oversized story is consuming all capacity. Pull the team off it and split it, or accept it will not ship this sprint and pick a smaller item.
The Bounce: actual dips below ideal early, then climbs back upA few easy items close in the first two days, the chart looks great, then the rest of the work hits friction and the gap widens. Usually points are awarded too generously on small items and too stingily on integration-heavy ones. Recalibrate during the next refinement, not mid-sprint.
The shapes are diagnostic, not directives. A Wave on a single sprint is noise. A Wave across three consecutive sprints is a signal about how the team accepts mid-sprint requests.
Where the burndown lies
Four assumptions inside the chart, each of which fails often enough to matter. The chart's strength is also its limit: it compresses sprint reality into one line.
Scope is the biggest lie. The burndown assumes the backlog is fixed at day zero. When a client emails a new request on day five and the team adds five points, the actual line stalls or bumps up. The chart tells you the team is behind. It does not tell you why. Burnup charts solve this by showing scope and completion as two separate lines, which is what the widget above demonstrates.
Quality is the second lie. A story closed with a critical bug counts the same as one that ships clean. The chart treats "done with debt" identically to "done." Mike Cohn, who codified release burndown variants at Mountain Goat Software, makes the point that the artifact needs an honest companion.
"The ScrumMaster should update the release burndown chart at the end of each sprint." - Mike Cohn, Mountain Goat Software
Estimation is the third lie. Story points are subjective. A team that quietly inflates points to make the chart look good ships the same amount of work but reads the chart wrong. The Agile Alliance glossary captures this directly.
"Burndown charts only show completed story points, not scope changes in the backlog." - Agile Alliance Glossary
Definition of done is the fourth lie. A team that marks items done at "code merged" produces a different chart than a team that marks done at "deployed to production." Neither definition is wrong. Comparing two teams' charts without knowing each definition is meaningless.
Burndown vs burnup vs Gantt
Three artifacts compete for sprint visibility. The honest choice depends on what the team needs to see.
Artifact
Shows
Best for
Burndown
Remaining work over time, against an ideal line.
Single-sprint visibility with fixed scope. Daily standup talking point.
Burnup
Completed work and total scope as two separate lines.
Multi-sprint releases, agency work with shifting scope, any team that wants scope changes legible.
Kanban teams that care about flow bottlenecks more than commitment.
For sprint-level visibility inside a Scrum cadence, burndown and burnup are direct competitors. The burnup wins anywhere scope is not stable, which is most agency work. The burndown wins where the team needs a single number for the daily standup and the backlog is genuinely locked at sprint planning.
Burndown charts for agency teams
Most burndown content assumes a single in-house product team scoring its own backlog against its own goals. Agencies break that frame in three ways. The work spans clients, each with their own definition of done. The backlog is not the team's to set; the client edits it. The sprint is rarely a clean two-week container because retainer work flows around fixed monthly commitments.
The chart still works inside a single client's sprint backlog, with one adjustment: assume scope will change and pick the chart that makes that visible. Burnup makes scope a co-protagonist. When the client adds five points on day five, the burnup ceiling rises in plain sight. That is the right conversation to have with the client in the next check-in. The burndown shows a stall, which the client reads as the team being behind, and the conversation turns adversarial.
Across clients, neither chart is meaningful. A 40-point sprint at Client A is not comparable to a 40-point sprint at Client B. The points were estimated by different teams against different stories. Track each client's sprint chart inside that client's space, and use a separate dashboard for cross-client capacity, usually based on hours rather than points.
The operational rule that compounds: share the chart with the client at the end of each sprint. Most agencies hide the chart, treating it as an internal tool. Sharing it surfaces scope conversations before the next sprint, when they are still cheap. Hiding it pushes those conversations to the end of the engagement, when they are not.
What we recommend at Rock
Rock is not a dedicated agile tool, but most of our customers run sprints inside the same workspace they use for chat. The pattern that works is small: keep the chart, the daily standup, and the work in one place. A burndown image pasted into a Notion doc that nobody opens between standups is a burndown that does not exist.
Practical setup: each sprint has a Rock space. The task board holds the stories with their point estimates in the description. The chart lives as a pinned message in the space chat, refreshed daily by the Scrum master. The standup happens in a thread off that message, which means anyone reading the chat sees the chart and the conversation about it together. When a scope change comes in from the client, it gets logged as a task and tagged so the chart update at end-of-day catches it.
For agency teams running multiple client sprints, each client gets its own space with its own chart and standup thread. The chart format is identical across spaces, so a project lead moving between three clients reads three charts that look the same. This is the practical reason the chart format matters more than the choice between burndown and burnup. Consistency across boards is what lets the team scale beyond two clients.
The sprint chart lives in chat where the team already looks. The standup happens in the thread underneath.
One last move: re-read the past three sprints' charts together at the start of every quarter. Patterns repeat. Teams that hockey-stick once usually hockey-stick three sprints in a row. Spotting the shape across multiple sprints is what turns the chart from a daily reminder into a planning input for the next quarter.
Frequently asked questions
What is a burndown chart used for?
A burndown chart shows how much work is left in a sprint or release, plotted against time. Teams use it to spot when work is piling up faster than expected. It is a visibility tool for the team and stakeholders, not a planning tool.
What is the difference between a burndown and a burnup chart?
A burndown chart shows remaining work descending toward zero against a fixed scope assumption. A burnup chart shows completed work climbing while plotting total scope as a separate line. When scope changes mid-sprint, the burndown line stalls without explanation; the burnup line shows the scope ceiling rising, which makes scope changes visible rather than hidden.
Who creates the burndown chart?
The Scrum master typically owns the update cadence. The team supplies the data by closing tasks and updating remaining estimates. The chart is a shared artifact, not a manager's tool. The Scrum Guide 2020 removed burndown as a required artifact, so the choice to maintain one is the team's.
How do you read a burndown chart?
Read the gap between the dashed ideal line and the solid actual line. Above ideal means work is piling up. Below ideal means the team is ahead. Pay more attention to the shape across days than to any single data point. Three consecutive days above the ideal line is the action signal, not a single bad day.
What is a sprint burndown chart?
A sprint burndown is a burndown chart scoped to a single sprint, usually one to four weeks. The x-axis is sprint days; the y-axis is remaining story points or hours for the sprint backlog. It is the most common variant and the one used as the daily standup talking point.
Is the burndown chart still used in Agile?
Yes, but as an optional tool. The Scrum Guide 2020 removed burndown charts as a required artifact, referring instead to "trends" generically. Teams that use them now do so by choice. Many modern teams substitute or pair burndown with burnup, cumulative flow, or velocity charts.
What are the disadvantages of a burndown chart?
The chart assumes fixed scope, treats all completed work as equal regardless of quality, and depends on honest story-point estimates. It also rewards "marking done" at the right moment rather than actual delivery. Burnup charts address the scope-creep blindness; the other limits are inherent to any single-line visibility artifact.
Can I make a burndown chart in Excel?
Yes. Two columns: day number and remaining points. Plot as a line chart, then add a second series for the ideal line (linear from total to zero). The interactive widget above is the same idea without the spreadsheet. Excel is still useful when the team wants a static record at end of sprint.
A burndown chart is a single line that should not be read alone. Pair it with a burnup when scope shifts, and treat the shape as the message rather than any one day's dot. Rock combines chat, tasks, and notes in one workspace, so the sprint chart lives where the team already works. One flat price, unlimited users. Get started for free.
RICE scoring is a four-variable formula that ranks initiatives by expected value per unit of effort. The math is simple: Reach times Impact times Confidence, divided by Effort. Sean McBride built it on the Intercom growth team in 2018 to settle internal arguments about which features to ship next. Most product, marketing, and operations teams now use some version of it.
The framework's strength is also its weak point. Multiplying by Confidence creates the illusion of math when three of the four inputs are still guesses. This guide explains how to score each variable honestly and walks through a worked example. It also stress-tests the model so you can see how a small confidence error reshuffles your backlog.
Quick answer: what RICE scoring is
RICE scoring is a prioritization formula: Reach times Impact times Confidence, divided by Effort. Each variable gets a numeric score, the formula produces a single number, and initiatives are ranked highest to lowest. The framework was invented at Intercom in 2018 to break ties between competing roadmap items.
Reach is the count of people a project will affect in a defined window. Impact is the size of effect on each person, scored on a 0.25 to 3 scale. Confidence is the percentage certainty in the other three numbers. Effort is the work required, usually counted in person-months. Higher reach, impact, and confidence raise the score; higher effort drops it.
Stress-test your scores in the widget
Type your own initiatives into the table below, or edit the three sample rows. The widget computes RICE in real time. Then drag the stress slider to drop confidence across every initiative by 5 to 40 points. Watch which ones lose the most score, and whether the top of the ranking flips.
Most product teams overestimate confidence by 20 to 30 points on first read. The widget makes that error visible.
Confidence Stress-Tester
Three sample initiatives below. Edit the values, then drag the stress slider to see what happens to the ranking when your confidence was higher than reality. Most teams overestimate confidence by 20 to 30 points.
Initiative
Reach (#)
Impact
Confidence %
Effort (mo)
RICE
Stress test: drop confidence by
0 points
Slide right to simulate confidence calibration error. Watch which initiatives lose the most score, and whether the top of the ranking flips.
Rock pairs a task board with chat and notes, so RICE scores, the debate behind them, and the work itself live in one space. One flat price, unlimited users.
Each variable has a canonical scoring scale that Intercom published in the original post. Teams that drift off these scales lose the ability to compare scores across projects. That comparison is most of the point of using RICE.
Variable
How to score it (Intercom canonical scale)
Reach
Count of people affected in a defined window. Pick a unit and stick with it: users per quarter, leads per month, signups per release. Pull from analytics, not from memory.
Impact
Massive = 3. High = 2. Medium = 1. Low = 0.5. Minimal = 0.25. Score per affected person, not in aggregate. Use the strongest available proxy: conversion lift, retention delta, support-ticket drop.
Confidence
High = 100%. Medium = 80%. Low = 50%. Under 50% means you should not score the item yet; run a discovery spike first.
Effort
Person-months of work across product, design, and engineering. Round to the nearest half-month for items under three months, full month for anything longer.
The most common mistake is reusing a Reach number from a different window. A feature that touches 5,000 users per quarter is not equivalent to one that touches 5,000 users per year. Pick one window for the whole prioritization round and apply it to every initiative.
Confidence is the variable that quietly does the most damage. Itamar Gilad, who favors the related ICE framework, explains the tension well.
"Many ICE practitioners, me included, argue that Reach is simply a component of Impact, and not necessarily a component you always want to factor. An idea that only impacts a small, but very highly-engaged subset of users (power users) can be of high impact although it's low in reach." - Itamar Gilad, ICE Scores
A worked example, step by step
An agency considering three roadmap items for the next quarter scores each one using the canonical scale. The team uses a quarterly Reach window and counts effort in person-months across two engineers and one designer.
Initiative
Reach
Impact
Confidence
Effort
RICE
Client comment threads on deliverables
800
2
60%
4
240
Rebuilt reporting dashboard with custom metrics
400
3
90%
6
180
Three-step onboarding wizard for new clients
1,000
1
80%
4
200
The math: 800 times 2 times 0.6 divided by 4 gives 240 for the comment threads. The dashboard, despite its higher impact and confidence, lands at 180 because of a longer build. The onboarding wizard hits a broad audience but at low impact, landing at 200. The team would ship in that order.
If the team had only looked at impact, the dashboard would have led. If only effort, the wizard. RICE is meant to surface this kind of cross-variable tradeoff. The risk is that the numbers feel more solid than they are, which is the next section.
Where RICE's math lies
The formula multiplies four numbers, three of which are estimates. Multiplication amplifies error. A 20-point miss on Confidence does not feel large in conversation, but in the math it changes the score by 20 percent. In a competitive backlog where the top three items sit within 10 percent of each other, that error reshuffles your priorities.
Jens-Fabian Goetzmann put the problem plainly after years of using the framework.
The five honest weaknesses are worth naming, because every team using RICE will hit them eventually.
False precision from confidenceMultiplying by a percentage gives the formula the look of math, but Confidence is a gut score. The widget above shows how a 20-point shift in confidence can flip the top of a ranking. Treat scores within 15 percent of each other as a tie, not a decision.
Reach is the easiest number to fudgeTeams pull Reach from whatever analytics view supports the case they want to make. Pick the window once for the entire round, source the number from a defined report, and write the source next to the score so the next person can audit it.
Impact is subjective and not benchmarked"High" versus "Massive" is judgment, not data. Teams that score Impact in isolation usually compress everything to 1 or 2. Calibrate by scoring three known features after launch first, then anchor new estimates against them.
Effort underestimation is the rule, not the exceptionPerson-months is the unit Fred Brooks discredited in 1975 because the work does not scale linearly with headcount. Use effort as a relative comparison between items in the same round, not a hard project estimate.
No room for dependencies, tech debt, or strategic betsRICE assumes initiatives are independent and benefits are tactical. Foundational work, debt cleanup, and "we need to be in this market in 18 months" bets always score low. Keep a separate lane for those, or they will be cut every quarter.
The original framework's author, Sean McBride, acknowledged this directly in the post that introduced RICE.
"RICE scores shouldn't be used as a hard and fast rule. There are many reasons why you might work on a project with a lower score first." - Sean McBride, Intercom Blog
RICE vs ICE vs MoSCoW vs WSJF
Four prioritization frameworks come up repeatedly. They are not interchangeable. RICE assumes you can quantify reach and effort. ICE drops the Reach factor and runs faster. MoSCoW sorts items into categories rather than ranking them. WSJF, from SAFe, swaps Effort for Job Size and adds a Cost of Delay factor for time-sensitive work.
Framework
Formula
Best for
RICE
Reach times Impact times Confidence, divided by Effort.
Product roadmaps where you can attach numbers to reach. Quarterly planning across 10-plus items.
ICE
Impact times Confidence times Ease (or 1/Effort).
Faster scoring rounds, growth experiments, marketing campaigns where reach is uncertain or always large.
Daily task triage by a single person. Not designed for team backlog scoring.
The honest move is to use two frameworks in parallel for different decisions. MoSCoW lets stakeholders agree on what ships in a release. RICE ranks items inside the "Must" and "Should" categories. Eisenhower handles the daily triage. WSJF flags the work that has a clock attached to it. None of them is the right answer for every kind of decision.
When not to use RICE
RICE is a quantitative tool. It works when the inputs are real numbers and the team trusts those numbers. Several common situations break those assumptions, and forcing RICE on them gives a false sense of rigor.
Skip RICE when reach is genuinely uncertain or the user base is small. A team of five customers cannot be scored on Reach without absurd math. Use ICE or qualitative judgment instead. Skip it when the work is foundational. Refactors, migrations, and tech-debt cleanup always lose to user-facing features in RICE math, even when the foundational work is urgent. Run those in a separate lane.
Skip it when the decision is political. If three executives need to agree on what ships next quarter, the conversation is not about scores. It is about who gets credit and what message the roadmap sends. MoSCoW or a stack-rank workshop reaches agreement faster than any formula. Skip it when the team is brand new. Scoring requires calibration across past work; teams in their first six months have nothing to anchor against.
RICE for agency teams
Most RICE writing assumes one team, one product, one goal. Agencies do not work that way. A designer ships work across five clients. An account manager juggles eight retainers. The four variables behave differently when the work spans clients, and the framework does not adjust for it on its own.
Reach is the variable that breaks first. An 800 for Client A, a direct-to-consumer brand with 200,000 monthly visitors, is not the same 800 for Client B. Client B is a B2B firm with 30 named accounts. The percentages mean different things to each business. RICE without normalization rewards the loudest client. The fix is to score Reach within each client's backlog separately, and never compare RICE scores across clients.
The cleaner pattern for cross-client decisions is to swap Reach for Revenue or Strategic Value. A retainer worth $20,000 per month is a different priority than one worth $5,000, even if both have 100 affected end-users. This is closer to WSJF territory: Cost of Delay divided by Effort. Agencies that have tried strict RICE across clients tend to migrate toward this version within two quarters.
One operational rule helps inside a single client's backlog. The client should see the scores. Most teams hide them, treating RICE as an internal scoring exercise. Sharing the rank with the client surfaces disagreements early, before the team ships the wrong thing. Why does the dashboard rank below the comment threads? That is the conversation the team needs to have before sprint planning, not after the work is half-built.
What we recommend at Rock
Rock is not a dedicated product management tool, but most of our customers run prioritization rounds inside the same workspace they use for chat. From that vantage, the pattern that works is small: keep the scores, the debate, and the work in one place. Spreadsheets and standalone tools split the conversation from the artifact, which makes the scores easier to ignore once the sprint starts.
Practical setup: a scoring doc lives in the Notes section of the relevant space. The four columns are Reach, Impact, Confidence, Effort. A fifth column holds the source for each number, so the next person can audit. Once the round is complete, the top-ranked items move into the task board as cards. The card description carries the score and the reasoning. When a stakeholder asks why item three ranks above item seven, the answer is one click away.
For agencies running multiple client backlogs, each client gets its own space with its own scoring doc and task board. The format is identical across spaces, so a project lead moving between three clients reads three docs that look the same. The strict template matters more than the choice of variables, because consistency is what lets the team scale beyond two or three clients.
Top-ranked RICE items become task cards. The score and reasoning live in the description so the work and the math do not drift.
Free resource: the Agile Sprint Planning template ships with backlog, sprint, and review columns ready to receive your scored items.
One last move that compounds: re-score the top five items at the end of each quarter. Compare the post-launch reality to the original scores. The team that does this for four quarters running gets meaningfully better at the Impact and Confidence numbers. The calibration is built from their own past work. The team that never re-scores keeps making the same calibration errors.
Frequently asked questions
What does RICE stand for in scoring?
RICE stands for Reach, Impact, Confidence, and Effort. The first three are multiplied, the result is divided by Effort, and the output is a single score used to rank initiatives against each other. The framework was created by Sean McBride at Intercom in 2018.
What is the RICE scoring method used for?
RICE is used to rank competing product, marketing, or operations initiatives by expected value per unit of effort. It is most common in quarterly roadmap planning when a team has more ideas than capacity and needs a defensible way to decide what ships first.
What is a good RICE score?
There is no absolute number. A RICE score is only meaningful when compared to other RICE scores in the same round, scored against the same Reach window and effort unit. Pay attention to the relative ranking, not the headline figure. Treat any two scores within 15 percent of each other as a tie.
What is the difference between RICE and ICE?
RICE multiplies Reach, Impact, and Confidence, then divides by Effort. ICE drops the Reach factor and multiplies Impact, Confidence, and Ease (the inverse of Effort). ICE is faster and works for cases where reach is uncertain or always large. RICE is better when you can attach a real number to reach.
Who invented RICE scoring?
Sean McBride, then a product manager on the Intercom growth team, published the original RICE post on the Intercom blog in 2018. The framework grew out of internal arguments about which experiments to ship next and was meant to give the team a shared structure for making the call.
What are the disadvantages of RICE scoring?
RICE multiplies four numbers, three of which are estimates, so small errors compound. Confidence is gut-judged. Effort is hard to estimate honestly. Foundational work and strategic bets always score low. The math also assumes initiatives are independent, which is rarely true on a real roadmap.
How is RICE different from MoSCoW or Eisenhower?
RICE produces a numeric ranking. MoSCoW sorts items into Must, Should, Could, and Won't categories without ranking inside them. Eisenhower is a 2x2 grid for daily task triage by an individual. Most teams use two or three of these for different decisions rather than picking one.
Can agencies use RICE scoring across clients?
Strict RICE breaks down when scoring across clients because Reach numbers from different client bases are not comparable. The cleaner pattern is to score RICE inside each client's backlog separately and use a different model, often closer to WSJF, for cross-client decisions about where to put agency capacity.
RICE scoring is simple math built on top of four estimates. Used honestly, with the stress-test in mind, it is a faster way to defend a roadmap decision than a long argument. Rock combines chat, tasks, and notes in one workspace so the scoring, the debate, and the shipped work stay together. One flat price, unlimited users. Get started for free.
A user story template is a one-sentence frame for capturing what a user needs and why. The canonical version reads "As a [role], I want [feature] so that [benefit]," and it has been the working language of agile teams for two decades. The format is simple. Writing one that actually helps the team is harder.
Most templates floating around the web are static Word or Excel files. They tell you the structure but leave the hard part, writing acceptance criteria that pass the INVEST test, as homework. This guide ships with an interactive builder that drafts the story, adds acceptance criteria in two formats, and flags weak inputs in real time.
Quick answer: the user story template
The user story template is "As a [role], I want [feature] so that [benefit]." It captures three things in one sentence: who needs the work, what they want to do, and why it matters.
Acceptance criteria sit underneath and define when the story is done. The most common format is "Given [context], when [action], then [outcome]." Together, the story plus its criteria are the working contract between a product owner and the development team.
Build a story in the interactive editor
Type a role, a goal, and a benefit. The builder writes the canonical sentence as you go and lets you add acceptance criteria in Given/When/Then or checklist format. Click "Save story" to stack multiple stories and copy each one to your backlog tool.
User Story Builder
Fill the three fields. The builder writes the sentence, adds acceptance criteria in either format, and stacks stories you can copy to your tool of choice.
As a (role)
I want to (goal)
So that (benefit)
As a role, I want to do something, so that there is a clear benefit.
Rock pairs chat with a task board, so stories, acceptance criteria, and the conversation around them stay in one space. One flat price, unlimited users.
A user story has three pieces. The role is the person who benefits from the work. The goal is what they want to do. The benefit is why it matters to them or the business. The format is intentionally short because the story is meant to start a conversation, not finish one. Mike Cohn, who codified the form in User Stories Applied, makes the point directly.
"User stories are designed to strongly shift the focus from writing about features to discussing them. Every user story is a placeholder for a future conversation." - Mike Cohn, Mountain Goat Software
The fourth piece, acceptance criteria, lives underneath the sentence. The story says what to build. The criteria say how to know it is done. Skip the criteria and the team commits to vague work; skip the role and the team builds for an imagined user nobody can name.
Ron Jeffries called the three working parts of a story Card, Conversation, and Confirmation. The written card prompts the team conversation. The confirmation is the test that closes it out.
Four template formats compared
Connextra is the canonical "As a / I want / So that" frame and works for most teams. Three alternatives have earned a place in the toolkit for specific reasons. Job stories drop the persona to focus on situation and motivation. The 5W variant adds where and when when context matters. Goal-oriented stories invert the form to lead with outcome.
Format
Template
When to pick it
Connextra
As a [role], I want [feature] so that [benefit].
Default. Works for product, agency, and internal team work. Pair with acceptance criteria.
Job story
When [situation], I want to [motivation], so I can [outcome].
You care about the trigger and the job to be done more than the persona. Common in product-led teams.
5W
As a [who], I want [what], in [where/when], so [why].
Mobile, location-based, or time-sensitive features where context shapes the design.
Goal-oriented
In order to [outcome], as a [role], I want [feature].
You want the story to start with the business outcome, not the user action. Helps with backlog ranking.
Pick one format per team and stick with it. Mixing styles inside a single backlog makes the items hard to compare, which is exactly the problem the template was meant to solve. The format choice matters less than the consistency.
Writing acceptance criteria
Acceptance criteria define the conditions the story must satisfy before it can ship. They are the difference between "the team thinks it is done" and "the product owner confirms it is done." Two formats cover almost every situation. Use Given/When/Then for behavioral stories where the flow matters. Use a checklist when the rules are independent and the order does not matter.
Format
Example for: "As a client, I want to comment on a draft so the agency can revise it"
Given / When / Then (scenario-based)
Given the client is viewing a shared draft, when they highlight text and click Comment, then a comment thread opens anchored to that text. And the agency receives a notification within 30 seconds.
Checklist (rule-based)
Client can comment without logging in via a shareable link. Each comment shows the author name and timestamp. Agency receives an email or in-app notification per comment. Comments are visible to all participants on the draft.
The third option, automated tests, sits one layer underneath. Given/When/Then maps cleanly to behavior-driven development tools like Cucumber, where the criteria become the test scripts. For teams without that tooling, treating criteria as a manual checklist the QA lead can walk through is enough. The point is that "done" has a defined meaning before development starts, not after the team shows the work.
User story examples by context
The template is the same; the context changes what makes a good story. Here are eight stories across the situations Rock users most often work in, each with one acceptance criterion to show the depth.
Context
Story + one acceptance criterion
B2B SaaS
As a workspace admin, I want to bulk-invite teammates via CSV upload so I can onboard 50 people without typing addresses.CSV with 100 rows uploads in under 5 seconds and shows per-row success or error.
Ecommerce
As a returning customer, I want to reorder my last cart so I do not rebuild it every time.Order History page shows a Reorder button next to each previous order.
Agency client work
As a client stakeholder, I want to approve a deliverable in one click so the agency knows it has the green light.Approval generates a timestamped audit log entry visible to the agency.
Internal tool
As a support lead, I want to filter tickets by team so I can see what my own team is working on.Filter persists across sessions for the logged-in user.
Mobile app
As a commuter, I want offline mode for saved articles so I can read on the subway.Articles saved on Wi-Fi are readable with airplane mode on.
API / integration
As a third-party developer, I want webhook payloads to include a unique event ID so I can deduplicate retries.Event ID is unique per event and included in every retry of that event.
Onboarding
As a new user, I want a guided three-step setup so I can start using the product without reading docs.User can skip any step and return later via the home screen prompt.
Admin / settings
As an owner, I want to export all workspace data so I have a backup before changing plans.Export delivers a ZIP via email within 10 minutes of the request.
User stories for agency teams
Most user story advice assumes a single product, one product owner, and a clear end user inside the company. Agency work breaks all three assumptions. The product is whatever the client paid for this month. The owner is split between the account lead and the client contact. The end user might be the client itself, the client's staff, or the client's customers.
The template still works, but the role field needs to be precise. "As a user" is a non-answer; it could mean six different people. Write "As a client stakeholder reviewing a deliverable" or "As an end customer signing up through the form we built." That level of specificity saves the team from building for the wrong audience.
The second adjustment is the benefit clause. Internal product stories often have benefits like "so I save time" or "so I feel confident." Agency stories should tie back to the client's stated goal in the brief. If the engagement is about reducing customer support load, the benefit clause should read like a child of that goal. This makes prioritization conversations easier because every story can be ranked against the same north star.
Finally, treat the client as a participant in the conversation Mike Cohn talks about. Share the top stories before each sprint backlog is locked. Clients who see the story before development starts catch ambiguity that the agency team would not. Clients who only see the finished work catch the same ambiguity, but it costs a rework cycle instead of a five-minute message.
INVEST: the quality test
Bill Wake coined INVEST as a checklist for spotting weak stories before they enter a sprint. A good story is Independent, Negotiable, Valuable, Estimable, Small, and Testable. Run through it manually before any story crosses into the next sprint. Each letter is a judgment call, not a heuristic a tool can score for you.
IndependentIThe story can be built and tested without waiting on another story. Dependencies force the team to plan around an order, which kills the flexibility that makes a backlog useful. If two stories must ship together, ask whether they are really one story.
NegotiableNThe story is an invitation to a conversation, not a contract. The team and product owner should be able to adjust scope, change the implementation, or split the story in half during refinement without breaking it.
ValuableVSomeone outside the development team gets value when the story ships. If the only beneficiary is the team itself, the work is internal cleanup and belongs in a different lane than user-facing stories.
EstimableEThe team can attach a size, even a rough T-shirt size, after reading the story. A story that no one can estimate has either missing context or hidden complexity that needs a spike first.
SmallSThe story fits inside a sprint with room for testing. Stories that span sprints are epics in disguise; split them into vertical slices, each delivering visible value, before they enter sprint planning.
TestableTAcceptance criteria exist and can be checked by someone other than the developer who built the feature. If the criteria read like "looks nice" or "feels fast," they are not yet testable.
Common pitfalls to avoid
Most weak user stories share one of a small set of failure modes. None of them are obvious in isolation, which is why teams keep shipping the same broken patterns sprint after sprint. The fix in each case is small and lives at the template level.
Role written as "user" or "customer""As a user" is the most common opening in broken stories. Six people inside the product fit "user" and they want different things. Write the specific role: account admin, returning shopper, support agent. Specificity unlocks every other choice the team makes.
Dev task disguised as a story"As a developer, I want to refactor the auth module" is engineering work, not a user story. It has no external user and no shippable value. Keep these in a separate technical-debt lane so they do not crowd out user-facing work in the same backlog.
Benefit clause stating the obvious"So that I can do my job" or "so that the app works" adds no information. The benefit clause exists to make the priority debate possible. If the benefit is universal, the story is not telling the team why it matters more than the story underneath.
No acceptance criteria, or criteria added afterA story without acceptance criteria is a request, not a unit of work. Treat the criteria as the second half of the template. Without them, the team and the product owner will disagree about "done" at the worst possible moment.
Epic masquerading as a story"As a buyer, I want a checkout flow" is not a story. It is an epic that contains a dozen stories. The INVEST "Small" criterion catches this. If the work cannot fit in a single sprint with testing time included, split it before it enters the backlog.
Mixing template formats in one backlogHalf the items use Connextra, a third use job stories, the rest are free-form. The team loses the ability to compare items at a glance, which is the point of having a template at all. Pick one format and enforce it during backlog refinement.
What we recommend at Rock
Rock is not a dedicated agile tool, but most of our customers run agile work inside the same space they use for chat. That gives us a useful vantage point on what actually happens to user stories after they are written. The pattern that works is small: keep the story, the conversation, and the work in one place.
Stories live as task cards on the space task board. The card title holds the story sentence; the description holds the acceptance criteria. The conversation that Cohn talks about happens in the card's comment thread, anchored to the story instead of scattered across email and Slack. When the story is done, the criteria become the checklist the team walks through before marking it shipped.
For agency teams running several client backlogs in parallel, each client gets its own Rock space. The same template applies inside each space, so a junior account manager moving between three clients sees three boards that look the same and read the same. This is the practical reason a strict template matters more than the choice of format. Consistency across boards is what lets the team scale beyond one or two clients without each backlog becoming a private language.
One operational tweak: write the story before the conversation, not after. The temptation in a client meeting is to take notes, then write the stories the next day from memory. Those stories are always weaker than ones written live. Writing on the spot forces clarification while the client is still in the room. A shared screen with the builder above, or any task tool open in front of the client, is the most underrated move in agency project management.
Each user story lives as a task card. The card title holds the sentence; the description holds the acceptance criteria.
A user story template is a one-sentence frame used in agile teams to capture a user need. The most common version reads "As a [role], I want [feature] so that [benefit]." It is paired with acceptance criteria that define when the story is done.
Who writes user stories?
The product owner writes the first draft of most user stories, since they own the priority order and the business context. Developers, designers, and QA refine the wording during backlog refinement. Clients and end users contribute through interviews and direct conversation.
What is the difference between a user story and a use case?
A user story is a short sentence meant to start a team conversation. A use case is a longer document describing every interaction step between a user and a system. Stories favor flexibility and discussion; use cases favor completeness and documentation.
What is the difference between a user story and an epic?
An epic is a large body of work that gets broken into several user stories. The test is whether the work fits in a single sprint. If yes, it is a story; if no, it is an epic and needs splitting before it enters a sprint backlog.
Do user stories need acceptance criteria?
Yes. A story without acceptance criteria is a request, not a unit of work. Without criteria, the team and the product owner will disagree about "done" at demo time. The two most common formats are Given/When/Then and a checklist of rules.
How long should a user story be?
One sentence in the template. The story itself fits on an index card; the acceptance criteria add another four to eight lines underneath. If the story needs paragraphs of context, it is usually an epic that should be split or a use case that does not belong in the backlog.
Can you use the user story template outside software development?
Yes. Marketing teams use it for campaign briefs, operations teams for process changes, and agencies for client deliverables. Any work that has a user, a goal, and a measurable outcome fits the frame. The acceptance criteria habit is the part that travels best.
A user story template is one sentence. Writing one that respects INVEST and ships with acceptance criteria is a discipline that compounds across every sprint. Rock combines chat, tasks, and notes in one workspace. One flat price, unlimited users. Get started for free.
Most long-term goals are set in a good meeting and forgotten in an ordinary week. A founding team blocks a day, argues productively, and lands on a three-year goal everyone believes in. The goal goes into a deck. Then Monday arrives, the client work lands, and the deck stays closed until the next offsite.
This guide treats a long-term goal as something a business runs, not something it announces. What separates a long-term goal from a vision statement. Why most of them quietly die, and the structural reason it has little to do with the goal itself. A five-step way to set one that survives a normal quarter. Examples by area, common pitfalls, and a Rock perspective on keeping the goal connected to the work.
Quick answer
A long-term goal for a business is a specific, measurable outcome the company commits to reach over roughly one to five years. It answers a different question than the work in front of you. Not what do we ship this month, but what kind of business do we intend to be. A strong long-term goal has a finish line you could photograph, a date, and an owner at the executive level. It is close to useless on its own. It works only when it cascades into yearly milestones and quarterly outcomes a team can act on now.
What a long-term goal actually is
Long-term usually means one to five years for a small or mid-sized business. Some strategy writing stretches it to ten, but a ten-year goal for a 5-to-50-person company is closer to a vision than a goal. Three years is the practical center. Long enough to require real change, short enough that the team setting the goal is still around to be accountable for it.
A long-term goal gets confused with three things it is not. Each is useful, and none of them does the job a goal does.
Not the same as
What it is
How it differs from a long-term goal
Vision statement
A direction, the kind of company you want to be
No finish line and no date, so it can never be reached or missed
Forecast
A prediction of the most likely future
Describes what will probably happen, does not commit the team to a result
Quarterly OKR
A 90-day objective with measurable key results
Too short to require structural change, it is the layer a long-term goal cascades into
Jim Collins and Jerry Porras gave the most ambitious version of a long-term goal a name in Built to Last, the BHAG, or Big Hairy Audacious Goal:
"A BHAG serves as a unifying focal point of effort, and acts as a catalyst for team spirit." Jim Collins and Jerry Porras.
A three-year revenue or market-position goal is the working-sized version of the same idea. The point Collins makes still holds at any size. The goal only does its job if the whole team can see it and rally to it. A goal nobody can see unifies nothing.
Why long-term goals fail
The uncomfortable finding is that the goal itself is rarely the problem. Robert Kaplan and David Norton, who built the Balanced Scorecard, found that fewer than 10 percent of well-formulated strategies are executed effectively. The gap is not in choosing the goal. It is in everything between the goal and Monday. Five failure modes show up across most teams.
The goal never cascades. It is set at the offsite, lives in a deck, and is never broken into a 12-month milestone or a quarter someone owns. The three-year goal and this week's work touch nothing in between, so the work drifts on its own.
Urgent work always wins. For a small team, client deadlines, hiring fires, and the next invoice are concrete and loud. The long-term goal is abstract and quiet. With no scheduled moment to defend it, the urgent crowds out the important every single week, and nobody decides that on purpose.
It lives in one person's head. Usually the founder. The team cannot move toward a goal they have never seen written with a number on it. Visibility is not a presentation nicety here, it is the mechanism that lets anyone other than the founder act on the goal.
Set once, reviewed never. A goal with a three-year horizon and no review cadence gets revisited in year three, when it is far too late to adjust. A long-term goal needs a regular check as much as a weekly task does, just on a slower clock.
Too vague to fail. "Be the market leader" or "grow the agency" cannot be missed, because they were never specific enough to hit. A goal you cannot fail is not a goal. It is a mood the leadership team agreed on.
How to set a long-term goal that survives
Setting the goal is an afternoon of work. Building the structure that keeps it alive is the part most teams skip. These five steps cover both, and the order matters.
Write the finish line as one measurable sentencePick a three-year horizon. Write the goal as a single sentence with a number and a date. "By December 2029, reach $2M in annual recurring revenue" beats "become a leading agency." If you cannot picture the finished state clearly enough to photograph it, keep editing the sentence.
Cut to one or two, and name what you will not chaseA business cannot pursue six long-term goals. Each one competes for the same attention and the same budget. Choose one primary goal, maybe a second, then write down what you are deliberately not chasing this cycle so the choice is real.
Backcast into yearly milestonesWork backward, not forward. For the three-year goal to be real, where must the business be in 24 months, and in 12. Each milestone is itself a measurable outcome, not a theme. This is the step that turns a goal into a chain you can pull.
Convert this year's milestone into quarterly outcomesTake the 12-month milestone and break it into four quarterly outcomes, each with one named owner. This is where the long-term goal meets the team's quarterly OKRs and short-term goals. If a quarter has no outcome tied to the goal, the goal is not moving.
Put it on the surface and review every quarterThe goal, the yearly milestone, and the current quarter's outcomes live where the team works, not in a separate deck. Review the whole chain once a quarter. Still the right goal, still on pace, still owned. A long-term goal earns its place by being looked at.
Step 2 is where the discipline lives. Strategy guidance from Michael Porter applies directly: "The essence of strategy is choosing what not to do." A long-term goal that does not force a trade-off is not steering anything. Step 3 is the one teams skip in practice. A long-term goal with no yearly milestones is a wish with a date attached.
Long-term goal examples by area
The examples below are written the way a leadership team would post them, with a number and a horizon attached. Pick the shape, then replace the figures with your own business reality. Borrowed targets that fit a different company's stage are worse than no target.
Area
Long-term goal example (1 to 5 years)
Growth
Reach $3M in annual recurring revenue by end of 2029
Grow from 20 to 60 retained clients in three years
Expand from one market to three within four years
Reach a point where half of new business comes from referral and inbound
Open a second hub in a new region within three years
Triple monthly qualified pipeline without raising ad spend
Profitability
Lift net margin from 8 to 18 percent over three years
Build a six-month operating cash reserve by 2028
Shift the revenue mix to 60 percent recurring within two years
Cut reliance on the top client from 40 to 15 percent of revenue
Raise average project value 50 percent by moving upmarket
Reach the point where the business funds its own growth
Market position
Become a top-three name in one service niche within four years
Publish 50 client case studies in three years
Earn certification or partner status with two major platforms by 2028
Build a branded point of view that generates inbound on its own
Win two industry awards judged on client outcomes
Reach 30 percent unaided brand recall in the target niche
Product or capability
Productize the top service into a fixed-scope offering within 18 months
Build in-house a capability the business currently outsources
Cut average delivery time per project by 40 percent over two years
Launch a recurring-revenue product alongside the service business
Reach a state where any project ships without the founder's input
Cut delivery cost per project 25 percent through documented systems
Team and organization
Promote three team members into leadership roles in three years
Reach a state where the founder is out of daily delivery
Document the operating system so onboarding takes one week, not one quarter
Cut annual team turnover from 25 to under 10 percent
Build a bench deep enough to lose any one person without a project stalling
Set a clear progression ladder for every role by 2028
Two things hold across the list. Every goal names a number and a horizon, so an outsider could tell whether it was reached. And every one describes a different business than today, not a slightly busier version of the current one. A long-term goal that does not change what the company is should probably be a short-term goal instead.
A long-term goal, fully cascaded
A flat list of examples is the easy part. The reason most long-term goals fail is that they never get broken down past the headline. So here is one goal taken all the way down, the way it has to look to actually move work. Take the first growth example, $3M in annual recurring revenue by 2029, and backcast it.
Level
The goal at this level
Owned by
3-year goal
Reach $3M in annual recurring revenue by December 2029
$1.1M ARR, 30 retained clients, the core service productized and selling
Department heads
This quarter
Sign 6 new retainers and lift average retainer value by 15 percent
Sarah, Head of Growth
Read the table bottom to top and the logic holds. The quarter's outcome is a step toward the 12-month milestone, which is a step toward the 24-month milestone, which is a step toward the three-year goal. Read it top to bottom and only the last row is something a person touches this week. That is the entire point. The three-year number does no work until it becomes a quarter that Sarah owns. A long-term goal missing any of these rows is not a goal yet. It is a headline waiting for the structure underneath it.
Common pitfalls
Six failure modes show up most often when a team tries to run a long-term goal rather than just announce one. The first three are visible the day the goal is written. The last three stay hidden until a year of effort has gone somewhere else.
A vision statement wearing a deadline"Be the agency clients trust most" is a direction, not a goal. With no number, it cannot be reached or missed. Add the measure that would prove it, or call it a vision and keep it separate.
Be the best, the biggest, the firstSuperlatives feel ambitious and measure nothing. Replace each one with the specific number that would make the claim true, then commit to that number instead.
Six goals competing for one budgetMore than two long-term goals and they starve each other of attention and money. Every goal slows down. Pick the primary one, sequence the rest, and say so out loud.
No yearly milestonesA three-year goal with nothing in between is checked once, at the end. Backcast it into 12- and 24-month markers, or it will never cascade into the work.
Set once, then filedA long-term goal reviewed only at the next offsite is a goal you find out about too late to fix. Put it on a quarterly review cadence from day one.
Disconnected from the quarterIf the long-term goal does not show up in any current quarterly objective, the team is not working toward it, whatever the strategy deck says.
Writing failures are cheap to fix, because you catch them at the whiteboard. System failures are expensive, because the cost only shows up at the yearly review when the quarter-by-quarter drift has already compounded.
What we recommend
A long-term goal survives when the chain from goal to this quarter is visible in one place. The common mistake is to keep three separate artifacts: a vision deck, an annual plan, and a task tool. The goal sits in the first, the work happens in the third, and nothing keeps them in sync. By the second quarter, the deck and the work describe two different companies.
The pattern that holds up at the 5-to-50-person scale is a single connected line. The three-year goal at the top. This year's milestone below it. The current quarter's owned outcomes below that, in the same workspace the team uses to coordinate every day. Anyone can trace one to the other in a few clicks, and the quarterly review walks the whole chain rather than reopening a deck nobody has seen since the offsite.
Keep the long-term goal connected to the work.
Rock pairs Tasks, Kanban, and Calendar with team chat in one workspace. Hold the three-year goal, the yearly milestone, and this quarter's owned outcomes in the same place the team works every day.
Two failure modes to watch. First, the team sets the goal and never builds the milestones beneath it, so the goal stays a headline. The fix is the backcast in step 3, not a sharper headline. Second, the long-term goal cascades onto a quarterly layer nobody is actually running. If the quarterly rhythm is dead, reviving it comes first, because a long-term goal cannot cascade onto nothing.
For most teams, a long-term goal is worth setting only if it earns a place in the quarterly review. If it cannot survive being looked at every ninety days, it was a slogan. The goal is not the document. It is the chain that keeps three years of work pointed in one direction.
FAQ
What is a long-term goal?
A long-term goal is a specific, measurable outcome a business commits to reach over roughly one to five years. It defines the kind of company the team intends to build and acts as a reference point for shorter-term decisions. Strong long-term goals carry a number, a date, and an executive owner, and they cascade into yearly milestones and quarterly outcomes.
How long is "long-term", one, three, or five years?
For a small or mid-sized business, one to five years, with three as the practical center. A goal shorter than a year behaves like a quarterly objective. A goal beyond five years for a 5-to-50-person company behaves more like a vision than something you can hold a team accountable to.
What is the difference between a long-term goal and a vision statement?
A vision statement describes a direction with no finish line. A long-term goal has a number and a date, so it can be reached or missed. A vision can guide a long-term goal, but the goal is the measurable part. For the related distinction between goals and objectives, see goal vs objective.
How is a long-term goal different from a short-term goal?
Horizon and function. A short-term goal is a 1-to-90-day owned outcome where work actually finishes. A long-term goal sets the one-to-five-year destination those short-term goals cascade from. You need both: the long-term goal gives direction, the short-term goals produce motion.
Should long-term goals be SMART?
Mostly yes. The measurable and time-bound parts of the SMART framework are exactly what separate a long-term goal from a vision statement. The achievable part is looser here. A good long-term goal should feel ambitious enough that the path is not obvious on day one.
How many long-term goals should a business have?
One primary goal, occasionally a second. More than two and they compete for the same budget and attention, which slows all of them down. Sequence the rest across future cycles instead of running everything in parallel.
Can a long-term goal change partway through?
Yes, at a review point, not on a hard week. Markets shift and the business learns, so a long-term goal should be pressure-tested every quarter. What damages a team is not revising a goal deliberately, it is quietly abandoning one between offsites and never saying so.
Long-term goals hold up when the goal, the milestones, and the current quarter live in one place. Rock pairs Tasks, Kanban, and team chat in one workspace, with one flat price and unlimited users. Get started for free.
Most people do not run out of time. They run out of the day having dodged the one task that actually mattered. Eat the frog is a productivity method built to stop exactly that. You find the hardest, most important task on your list and you do it first, before email, before meetings, before the day fills up.
This guide explains what the method really means, where the famous Mark Twain quote actually came from, and why doing the worst task first works. It also covers the part most guides skip: when eating the frog backfires, and what to do instead. Run the frog test below to see whether the task on your mind is really a frog.
The frog test
Think of one task you keep putting off. Answer 4 questions about it to see whether it is the frog you should eat first.
1. How much would finishing this task move things forward?
Huge impact
Some impact
Minor impact
2. How much are you dreading it?
A lot
A little
Not really
3. Does it need your sharpest, uninterrupted focus?
Yes, deep focus
Some focus
No, routine work
4. Is anyone else waiting on it?
Yes, a client or teammate
Maybe one person
No one
See the verdict
Once you know your frog, give it a priority flag where the whole team can see it. Rock keeps tasks, priorities, and chat in one workspace.
Eat the frog is a time management method. You identify the most important and most difficult task of your day, then do it first, before anything else competes for your attention. The phrase comes from an old saying about doing the worst chore early so the rest of the day feels easier. Productivity author Brian Tracy popularized it in his 2001 book. The method works because focus and willpower are usually highest early, and finishing the hard thing removes the quiet dread that drags on the rest of your day. The one rule that trips people up: pick a single frog, not five.
Here is the shift I would call out. AI assistants make it easy to start almost anything, so just getting going is no longer the hard part. The hard part is choosing the right frog. The real risk now is spending your best hour on a task that feels productive but does not move the work.
What eating the frog means
The frog is a metaphor. It stands for the task you would most like to avoid, usually because it is hard, slow, or has an uncertain outcome. It is also the task that matters most. Those two traits tend to travel together. The work that moves a project forward is rarely the work that feels easy to start.
"Your 'frog' is your biggest, most important task, the one you are most likely to procrastinate on if you don't do something about it." - Brian Tracy, author of Eat That Frog!
The method is almost always credited to Mark Twain, with a line about eating a live frog first thing in the morning. Twain never said it. Researchers at Quote Investigator found no trace of the line in his work, and the earliest link to his name appears in a newspaper in 1988, decades after his death. The real ancestor is a line from the French writer Nicolas Chamfort, published around 1795.
"We should swallow a toad every morning, in order to fortify ourselves against the disgust of the rest of the day." - Nicolas Chamfort, French writer, via Quote Investigator
The misattribution does not change how useful the method is. It is a small reminder that a good idea spreads faster once it is pinned to a famous name. What matters is the instruction underneath, and that part has held up for two centuries: do the unpleasant, important thing early.
Why eating the frog works
Procrastination is common enough to count as the norm, not the exception. Research by psychologist Joseph Ferrari found that about 20 percent of adults are chronic procrastinators, people who routinely delay tasks across work and life. Eat the frog is popular because it works against that pull, and it does so for three reasons that have nothing to do with willpower in the heroic sense.
First, mental energy is a budget, not a constant. Focus and good decisions draw it down through the day. Doing demanding work early spends that energy on the task that deserves it, instead of on the twentieth small thing in your inbox.
Second, procrastination is rarely a scheduling failure. It is the mind avoiding the discomfort a task brings up, whether that is anxiety, boredom, or the fear of doing it badly.
"Procrastination is an emotion-regulation problem. It's not a time management problem." - Tim Pychyl, psychology professor at Carleton University, via Carleton University
Eating the frog works with that, not against it. You feel the discomfort once, early, for a defined task, instead of carrying it as background noise all day. Third, finishing the hard task creates momentum. Once the frog is gone, the rest of the list looks small, and a clear early win tends to pull the rest of the day along with it.
The frog is simply the highest-priority task you are most tempted to skip.
How to eat the frog
The frog test above gives you a fast read on a single task. The five steps below are the full routine, the version you run every working day until it becomes a habit.
List tomorrow's tasks the night beforeWrite the next day's tasks down before you stop work. Deciding what matters in the morning burns the fresh focus the method depends on, so make the decision while today's context is still in your head.
Pick the one frogFrom the whole list, find the task with the highest impact that you are also most tempted to skip. If two tasks qualify, eat the bigger one first. The hard part of prioritizing is being honest about which task you are avoiding.
Protect the first block of your dayBlock the first 60 to 90 minutes for the frog. No inbox, no chat, no meetings. The frog gets your sharpest and least interrupted time, because that is the time it actually needs.
Cut the frog down to a first moveA big frog is hard to swallow whole. Define the first concrete action, such as "draft the opening section", not "finish the proposal". Starting is the part the brain resists, so make starting small.
Eat it, then stop and reviewWork until the task is done or the time block ends, whichever comes first. Notice what made it hard to start. Tomorrow's frog goes down easier when you learn from today's.
Step two is where most of the value sits. If you are unsure which task qualifies, a quick pass with a method like prioritizing your tasks by impact will surface the frog faster than instinct alone.
Eat the frog for agency teams
Eat the frog was written for individuals. Agency work complicates it, because your frog and your team's frog are not always the same animal.
An account manager juggling eight retainers does not have one frog, they have a queue of them, roughly one per client. A designer's frog might be the concept work that needs deep focus, while the loudest thing in the channel is a small fix a client is waiting on. The method still helps, but a team needs a shared definition of what the frog actually is.
Two adjustments make it work. First, agree what counts as a frog in your context: the task most likely to slip, and most likely to hurt a client if it does. Second, make priority visible. When everyone can see which task carries the Urgent flag, the team stops guessing whose frog comes first and who can wait.
Make every team frog visible.
Rock pairs task priority, boards, and team chat in one workspace, so the most important task is something the whole team can see, not a private note buried in one person's head.
The biggest threat to a team frog is interruption. Every ping pulls focus, and the cost of context switching is measured in real lost time, not just a lost moment. Protecting the first block of the day is far easier when the team treats it as a shared norm rather than one person's quirk. It is the same principle as asynchronous work, which only works once the whole team agrees not to expect instant replies.
When the method does not work
Eat the frog is a good default, not a law. It rests on a few assumptions that do not hold for everyone, and forcing it when it does not fit just adds guilt to an already hard day. Five situations are worth knowing before you commit to it.
You are not a morning personThe method assumes peak energy arrives early. For genuine night owls, the sharpest hours land later in the day. Eat the frog then. The principle is "at your peak", not "at 8am".
The frog is a project, not a taskYou cannot swallow a frog that takes 20 hours in one sitting. Break it into daily, frog-sized pieces first, or the method just relocates the dread to a bigger animal.
A real emergency outranks the frogA client outage or a same-day deadline is not your frog, it is a fire. Put the fire out, then return to the plan. Rigidly guarding the frog through a crisis is not the point.
Some work needs a warm-upCreative and analytical work sometimes needs an easy task first to get rolling. A five-minute win can be the on-ramp to the frog, not a betrayal of the method.
You picked a toad, not a frogIf you eat the frog every day but the project still stalls, you are probably doing the hardest task, not the most important one. Hard and important are not the same thing. Re-check against impact.
None of these break the method. They refine it. The honest version is simple. At your best hours, do the most important hard task you can actually finish, and stay flexible when the day refuses to cooperate.
Eat the frog vs other methods
Eat the frog is one of several ways to decide what to do and when. They are not rivals. Most people end up combining two or three, because each one answers a slightly different question.
Work in focused 25-minute intervals with short breaks
You can start tasks but struggle to sustain focus
Time blocking
Assign every task a fixed slot on your calendar
Your day is fragmented and reactive
A common pairing works like this: use the Eisenhower Matrix to find the frog, then eat the frog to act on it. One method picks the task, the other gets it done. If focus fades partway through, a couple of Pomodoro intervals can carry you over the line.
What we recommend
From watching how teams of 5 to 50 people work inside Rock, the reason behind a missed frog is almost never laziness. It is visibility. The most important task sits in one person's head or a private list. Meanwhile the channel fills with smaller, louder requests that feel urgent mostly because they are the things everyone can see.
Our advice is to make the frog a shared, visible object. Give it a priority flag, put it on the board the whole team uses, and protect the first block of the day as a team norm, not a personal habit. When the frog is visible, nobody has to defend the quiet hour they spend on it.
That is easier when tasks and the conversation about them live in the same place. A ready-made task board template gets a team started in minutes, and the day's frog is one flag away from obvious. The method itself is simple. Keeping the frog visible is the part that makes it stick.
FAQ
What does "eat the frog" mean?
Eat the frog means doing your most important and most difficult task first thing, before any easier work. The frog is a metaphor for the task you are most tempted to put off. The idea is that once it is done, the rest of the day feels lighter and you stop carrying the task as background stress.
Did Mark Twain really say "eat the frog"?
No. The quote is widely attributed to Mark Twain, but there is no record of him writing or saying it. Quote Investigator traces the idea to the French writer Nicolas Chamfort in the 1790s. Brian Tracy's 2001 book Eat That Frog! is what spread the Twain version to a wide audience.
What is the eat the frog method good for?
It is best when you have one clear, important task you keep avoiding. It is less useful for sorting a long, messy list, because it does not tell you how to rank competing tasks. For that, pair it with the Eisenhower Matrix and let that method surface the frog.
When should I eat the frog?
At your highest-energy hours, which is the morning for most people but not everyone. The principle is to match your hardest task to your sharpest focus, not to a fixed clock time. If you do your best thinking at night, that is when your frog belongs.
What if I have more than one frog?
Pick one. Brian Tracy's rule is that if you must eat two frogs, eat the bigger one first. Trying to eat several frogs at once is just a longer to-do list with a metaphor on top, and it usually means none of them get your full focus.
Is eat the frog the same as time blocking?
No. Eat the frog tells you which task to do first. Time blocking tells you when every task in your day happens. They work well together: block the first hour of your day on the calendar, and spend it on the frog.
The hardest task of your day is easier to face when your whole team can see it. Rock keeps tasks, priorities, boards, and team chat in one workspace, with one flat price and unlimited members. Get started for free.
There is no shortage of project management methodologies. Counting the named approaches, their sub-variants, and the certification-backed frameworks, the list runs well past a dozen. The honest truth is that your team needs one, maybe two. The hard part is not learning all of them, it is matching the one you pick to the work you actually do.
This guide groups the 12 most-used project management methodologies into three families: predictive, adaptive, and hybrid. You get a plain definition of each, a comparison table, the situations each one fits, and the situations where it quietly fails. Run the selector below first to see where your team likely lands, then read the family that matches.
Which methodology fits your project?
Answer 4 questions. Get a recommended family and one or two specific methodologies matched to how your team works.
1. How clear are the requirements at the start?
Locked and signed off
Mostly clear
Likely to change
Largely unknown
2. How often will priorities shift mid-project?
Rarely
Sometimes
Constantly
3. What matters most to the people paying for the work?
Predictable scope and budget
Fast delivery of working pieces
Fewer defects and less waste
Formal governance and an audit trail
4. What best describes the work itself?
A small team on one defined project
A large or regulated project
A steady flow of incoming requests
A mix of planned and reactive work
See my recommendation
Whichever methodology you land on, Rock runs it. Tasks, Kanban, sprints, and team chat in one workspace.
A project management methodology is a structured set of principles and processes that defines how a team plans, executes, and delivers a project. The 12 most-used methodologies fall into three families. Predictive ones like Waterfall and PRINCE2 lock scope early. Adaptive ones like Scrum and Kanban expect change. Hybrid ones like Scrumban blend both, and hybrid is now the most common approach in practice. The right choice depends on how stable your requirements are, not on which methodology is most popular this year. Match the family to your work first, then pick one named method inside it.
The three families: predictive, adaptive, hybrid
Twelve named methodologies sounds like a lot to compare. It is easier once you see that almost all of them sit in one of three families. They sort by a single question: how much do you expect the work to change after you start?
Predictive. You plan the whole project up front, then execute the plan in order. Predictive methodologies suit work where the requirements are known and stable, such as construction, hardware, or a defined client deliverable. The strength is predictability of scope, budget, and timeline. The weakness is that change is expensive once the plan is set.
Adaptive. You plan in short cycles and adjust as you learn. Adaptive methodologies, often grouped under the Agile umbrella, suit work where the requirements will evolve, such as software, marketing, and product. The strength is responding to change without a costly replan. The weakness is that scope and budget are harder to fix in advance.
Hybrid. You plan the stable parts up front and run the uncertain parts in cycles. Hybrid is now the most common reality, not a compromise. According to Pulse of the Profession 2024, an annual survey from the Project Management Institute, the use of hybrid approaches rose from 20 percent of projects in 2020 to 31 percent in 2023. Purely predictive work declined over the same period.
Most teams do not need to memorize twelve methodologies. They need to know which family their work belongs to, then pick one named approach inside it. The Agile versus Waterfall debate is really just the predictive and adaptive families arguing past each other.
12 methodologies compared at a glance
The table below sorts the 12 methodologies by family, the work each one fits, and the situation where it tends to fail. Use it to shortlist two or three, then read the full entry for each.
Methodology
Family
Best fit
Skip it when
Waterfall
Predictive
Fixed-scope projects with clear requirements
Requirements are likely to change
Critical Path Method
Predictive
Schedule-driven work with task dependencies
Scope is loose or exploratory
Critical Chain
Predictive
Plans constrained by shared resources
Resources are plentiful and dedicated
PRINCE2
Predictive
Large projects needing formal governance
Small, fast-moving teams
PMBOK
Predictive
Standardizing practice across many projects
You want a ready-to-run method, not a reference
Agile
Adaptive
Work where requirements keep evolving
Scope and budget must be locked up front
Scrum
Adaptive
Feature delivery in fixed-length sprints
Work arrives unpredictably as a flow
Kanban
Adaptive
A continuous flow of incoming work
Work needs fixed, time-boxed commitments
Extreme Programming
Adaptive
Software teams needing engineering rigor
Non-software or non-technical projects
Lean
Adaptive
Cutting waste from a repeatable process
One-off work with no process to refine
Six Sigma
Adaptive
Reducing defects and process variation
Early-stage work with no baseline data
Scrumban
Hybrid
Teams moving from sprints toward flow
You need either pure sprints or pure flow
Predictive methodologies
Predictive methodologies, sometimes called traditional or plan-driven, share one assumption: you can define the work in detail before you start. They reward thorough planning and punish mid-project change. For a defined client deliverable or a regulated build, that trade is worth making.
Waterfall. The original predictive method. Work flows through fixed phases, requirements, design, build, test, and release, with each phase finishing before the next begins. It suits projects where the end state is known on day one. The catch is well documented. The engineer Winston Royce, whose 1970 paper is often credited with describing the model, was clear about its risk.
"The implementation described above is risky and invites failure." Winston W. Royce, software engineer, in his 1970 paper on managing large software systems, via Wikipedia.
Royce proposed feedback loops between phases, a detail the simplified Waterfall model often drops. Used with care, it still fits fixed-scope work.
Critical Path Method (CPM). A scheduling technique that maps every task, its duration, and its dependencies, then finds the longest chain of dependent tasks. That chain is the critical path, and any delay on it delays the whole project. CPM is less a full methodology than a planning layer you add on top of a predictive plan when the timeline is tight.
Critical Chain Project Management (CCPM). An evolution of CPM that focuses on resources rather than tasks. Instead of padding every task with a safety buffer, CCPM pools the buffer at the project level and schedules around the people and equipment that are shared across tasks. It fits plans where resource conflicts, not task logic, are the real constraint.
PRINCE2. A process-based method built around stage gates, defined roles, and a documented business case. PRINCE2 is strong on governance: every stage has a go or no-go decision, and accountability is explicit. That structure is valuable on large or public-sector projects and heavy on a six-person team.
PMBOK. Not a methodology in the strict sense. The Project Management Body of Knowledge is the Project Management Institute's reference of accepted principles and practices. Teams use it to standardize vocabulary and practice across many projects, then pair it with a methodology that actually prescribes day-to-day work.
Adaptive methodologies
Adaptive methodologies assume the opposite of predictive ones: you cannot fully define the work in advance, so you should plan in short cycles and adjust as you learn. Martin Fowler, one of the authors of the Agile Manifesto, framed the distinction directly.
"Agile methods are adaptive rather than predictive." Martin Fowler, Chief Scientist at Thoughtworks, in The New Methodology.
Agile. Strictly speaking, Agile is a set of values rather than a single method. It prizes working output, customer collaboration, and responding to change over rigid plans. Scrum, Kanban, and Extreme Programming are all ways to put Agile into practice. When people say their team is Agile, they usually mean one of those.
Scrum. The most widely used Agile method. Work happens in fixed-length sprints, usually one to four weeks, with defined roles and a regular cycle of planning, daily check-in, review, and retrospective. Scrum fits teams that can commit to a batch of work and protect it from interruption, and sprint length is a real decision in itself.
Kanban. A flow-based method built on a visual board and limits on work in progress. There are no sprints. Work is pulled into each stage only when there is capacity, which exposes bottlenecks fast. Kanban fits a continuous stream of incoming requests, such as a support queue or a marketing team fielding briefs. Comparing Kanban and Scrum directly is the cleanest way to choose between the two.
Extreme Programming (XP). An Agile method specific to software, focused on engineering discipline. Practices like pair programming, test-driven development, and continuous integration aim to keep code quality high while requirements change. XP rarely fits non-software work, but its quality practices have influenced every other Agile method.
Lean. Lean and the Six Sigma method that follows are process-improvement methodologies, grouped in the adaptive family because they improve continuously from observation rather than because they run in sprints. Lean, born in manufacturing, is the relentless removal of waste, meaning any step that does not add value for the customer. As a project methodology it is less about ceremonies and more about a mindset: map how work flows, find where it stalls, and cut the stall. It pairs naturally with Kanban.
Six Sigma. A data-driven method for reducing defects and variation in a repeatable process. It follows a defined improvement cycle and leans on measurement. Six Sigma shines when you have a process that runs often enough to gather data, and adds little to a one-off creative project.
Hybrid methodologies
Real projects rarely sit cleanly in one family. The discovery phase of a software build is uncertain, but the launch has a fixed date and a fixed budget. Hybrid methodologies accept that and let you plan the stable parts while iterating on the uncertain ones.
Scrumban. The best-known named hybrid. It keeps Scrum's planning rhythm and review cadence but replaces rigid sprint commitments with Kanban's flow and work-in-progress limits. Scrumban is a common landing spot for teams that find pure Scrum too rigid and pure Kanban too loose.
Plan-driven hybrid. The other common pattern is not a named method at all. You agree scope, budget, and milestones in a predictive plan to satisfy a client or a board, then deliver inside that envelope using Agile sprints. The plan gives stakeholders predictability. The sprints give the team room to adapt.
Hybrid works when the blend is deliberate. It fails when it is just two methods running at once with no agreement on which rules win. Henrik Kniberg, who wrote one of the early guides to combining the two, put the mindset plainly.
"Scrum and Kanban are both highly adaptive, but within a spectrum. Use whatever works for you. There is no perfect process." Henrik Kniberg, agile and lean coach at Crisp, in Kanban and Scrum: Making the Most of Both.
How to choose a methodology
The selector near the top of this article gives you a fast answer. The five steps below are the manual version, useful when you want to reason through the choice with your team rather than accept a recommendation.
Judge how stable the requirements areIf the end state is known and signed off, lean predictive. If it will be discovered as you go, lean adaptive. This single question settles the family choice more often than any other.
Check what the client or sponsor needs to seeA fixed price and a fixed date push you toward a predictive plan or a hybrid envelope. A sponsor who wants working output every few weeks pushes you toward Agile.
Match the method to the shape of the workPlanned batches of work suit Scrum. A constant flow of incoming requests suits Kanban. A defined linear build suits Waterfall. The shape of the work narrows twelve options to two or three.
Weigh your team size and appetite for processPRINCE2 and PMBOK add governance that a 50-person program needs and a 6-person team will resent. Pick the lightest method that still gives you the control the work requires.
Start light and adjust after two cyclesNo methodology is right on paper. Run it for two sprints or two months, hold a retrospective, and drop the ceremonies that add no value. The method should serve the team, not the other way around.
One reframe helps here. A methodology and a project management framework are close cousins, and the line between them is blurry in practice. Treat the choice as low-stakes and reversible. Most teams change their approach as they grow, and that is healthy, not a sign the first pick was wrong.
Run any methodology in one workspace.
Rock gives you Tasks, Kanban boards, sprints, and team chat together. Switch from Scrum to Kanban to a hybrid without changing tools or losing history.
Most methodology failures are not about the methodology. They are about how it was adopted. Six patterns show up again and again across teams of 5 to 50 people.
Picking by popularity, not by fitScrum is the most used method, so teams adopt it by default. A team fielding a constant flow of small requests will fight Scrum every sprint. Match the method to the work, not to the trend.
Adopting the ceremonies, skipping the principleA team can run every Scrum meeting and still not be adaptive. Standups and retrospectives are the visible shell. Responding to change is the actual point. Copy the principle first.
Forcing a predictive plan onto uncertain workWriting a detailed twelve-month plan for work nobody can yet define produces a precise document that is wrong by month two. If the work is uncertain, plan in cycles.
Running a hybrid with no rulesHybrid is deliberate blending. Two methods running side by side with no agreement on which rules win is just confusion. Decide up front what is planned and what is iterated.
Overloading a small team with governancePRINCE2 and PMBOK exist for a reason, but their overhead is built for large programs. On a small team, heavy process eats the time it was meant to protect.
Never revisiting the choiceThe method that fit at 8 people often strains at 30. Teams that never run a retrospective on their own process keep paying for a fit they outgrew a year ago.
The thread through all six is the same. A methodology is a tool, and like any tool it is only useful when it matches the job and the people holding it.
What we recommend
From watching how teams of 5 to 50 people actually work inside Rock, the pattern is clear. The teams that struggle are not the ones that picked the wrong methodology. They are the ones running their chosen method across three or four disconnected tools, with the plan in one place, the tasks in another, and the conversation in a third.
Our advice is to choose the lightest methodology that gives the work the control it needs, then run all of it in one place. If your requirements are stable, a predictive plan with clear phases is fine. If they shift, run Agile in Scrum or Kanban. If reality is mixed, which it usually is, a deliberate hybrid is the honest answer. Whatever you pick, the methodology should be visible where the team already talks.
That is the case for keeping tasks, boards, sprints, and chat together. When the Kanban board lives next to the conversation about the work, nobody has to reconcile two versions of the truth. A ready-made project management template gets a method running in minutes, and switching from sprints to flow later is a change of board, not a change of tool. The methodology matters. Not making your team pay a tax to run it matters just as much.
FAQ
What are the 3 main types of project management methodology?
Predictive, adaptive, and hybrid. Predictive methodologies such as Waterfall plan the whole project up front. Adaptive methodologies such as Scrum and Kanban plan in short cycles and expect change. Hybrid methodologies blend the two, planning the stable parts and iterating on the uncertain ones. Almost every named methodology belongs to one of these families.
What is the most used project management methodology?
Agile, and specifically Scrum, is the most widely adopted methodology, especially in software and product teams. Hybrid approaches are growing fastest. The Project Management Institute reported hybrid use rising from 20 percent of projects in 2020 to 31 percent in 2023 in its Pulse of the Profession 2024 survey.
Is a methodology the same as a framework?
In strict terms a methodology prescribes a full system of practices, and a framework gives a lighter structure you fill in yourself. In everyday use the words are treated as near-synonyms. Scrum is often called both. The practical advice is the same either way: pick the approach that matches your work, and do not get stuck on the label.
Which methodology is best for a small agency?
For a small agency juggling several clients, Kanban or Scrumban usually fits best, because client work arrives as an unpredictable flow rather than in neat planned batches. Heavy predictive methods like PRINCE2 add governance overhead a small team does not need. Keep the method light and visible.
Can a team use more than one methodology?
Yes, and many do. A delivery team might run Scrum while a support team runs Kanban, and a single project can use a predictive plan with Agile delivery inside it. The key is that each team or workstream has one clear approach, rather than mixing rules without deciding which ones win.
How do I switch methodology without disrupting the team?
Switch at a natural boundary, the end of a sprint, a quarter, or a project. Explain the why, run the new method for two cycles, then hold a retrospective. Keep tasks and history in the same workspace so the change is a new way of working, not a migration of all your data.
A methodology only works when the team can see it every day. Rock pairs Tasks, Kanban boards, sprints, and team chat in one workspace, with one flat price and unlimited users. Get started for free.
Casi todos los textos sobre metas a corto plazo las tratan como el calentamiento. Primero la visión a 5 años, después los OKR del trimestre, y al final algunos checkpoints mensuales para sentirse productivo. Ese orden está al revés. En un equipo de 5 a 50 personas, y especialmente en una pyme o agencia latinoamericana, la capa donde el trabajo realmente sucede son las metas a corto plazo. El objetivo anual es un eslogan hasta que se traduce en un mes que alguien lidera con su nombre encima.
Esta guía aborda las metas a corto plazo como un ritmo operativo de equipo, no como un ejercicio de planeación estratégica. La diferencia honesta entre el corto, el mediano y el largo plazo. Por qué en LATAM el ciclo mensual manda sobre el trimestral. Cinco pasos que se hacen en menos de una hora. 25 ejemplos por área pensados para equipos LATAM. Realidades como facturar en USD, convivir con aguinaldos en Q4 o coordinar con clientes en EST. Los errores recurrentes. Y la perspectiva de Rock para llevar el ciclo dentro del espacio donde el equipo ya trabaja.
Respuesta rápida
Una meta a corto plazo para una empresa es un resultado específico, con un dueño y una fecha, que el equipo se compromete a entregar entre 1 y 90 días. Es la capa operativa que convierte los objetivos anuales y los OKR del trimestre en algo que alguien puede cerrar antes de la siguiente revisión. Las metas que funcionan tienen una fecha exacta (no "fin de trimestre"), un solo responsable con nombre y una definición de "hecho" verificable desde afuera.
Corto, mediano y largo plazo
Los tres horizontes se usan de manera intercambiable en conversaciones de planeación, y ahí empieza la mayoría de los problemas. Cada uno vive en una altura distinta del trabajo, y tratarlos como sinónimos produce reuniones que discuten vocabulario en lugar de ejecución.
Dimensión
Corto plazo
Mediano plazo
Largo plazo
Horizonte
1 día a 90 días
3 a 18 meses
1 a 5 años
Pregunta que responde
¿Qué entregamos antes de la próxima revisión?
¿Qué capacidad construimos este año?
¿En qué tipo de empresa nos queremos convertir?
Dueño típico
Un colaborador individual o líder de equipo
Un líder de área o departamento
Fundadores, comité ejecutivo
Cómo aparece en la herramienta
Tareas, tableros de sprint, scorecards mensuales
OKR trimestrales, planes de año
Documento de estrategia, declaración de visión
Ritmo de revisión
Semanal o mensual
Trimestral
Anual
Falla más común
Es genérica, sin dueño o sin fecha
Se convierte en lista de deseos
Se queda en eslogan, no aterriza
La prueba más rápida. Si la meta no puede terminarse antes de la siguiente revisión regular, es de mediano plazo y necesita partirse. Si no tiene un responsable con nombre, todavía no es una meta, es una intención. El corto plazo es donde el largo plazo se materializa, o donde silenciosamente muere.
La realidad LATAM: por qué el mes manda sobre el trimestre
El manual estándar de planeación trimestral viene de equipos en Estados Unidos con flujos de caja predecibles, contratos anuales y nóminas estables. Esa no es la realidad de la mayoría de las pymes y agencias latinoamericanas. Forzar el formato trimestral en otro contexto es una razón importante por la que tantos sistemas de OKR no aterrizan en la región.
Tres dinámicas hacen que el ciclo mensual sea la unidad práctica de planeación en LATAM, no el trimestre.
El ciclo de caja es mensual. La mayoría de las pymes opera mes a mes en términos de facturación, cobranza, IVA, retenciones e ISR. Las metas más críticas, las que tocan caja, naturalmente se piensan en ese horizonte. Un OKR trimestral sobre ingresos sin metas mensuales debajo es teatro de planeación.
El Q4 no es como los demás trimestres. Aguinaldo en México (15 días de salario antes del 20 de diciembre), prima en Colombia, vacaciones colectivas en Argentina y Chile. La segunda mitad de diciembre está esencialmente cerrada para la mayoría de los equipos, lo que comprime el último trimestre real a 10 semanas en lugar de 13. Una meta trimestral pensada como si fuera Q1 falla por arquitectura del calendario.
El trabajo transfronterizo cambia el ritmo. Una agencia colombiana sirviendo clientes en Nueva York no factura en COP, factura en USD. Las metas operativas viven entre dos calendarios y dos husos horarios (COT y EST, o ART y EST). El brief llega un viernes a las 6 PM hora cliente, el equipo empieza el lunes a las 8 AM hora local, y la ventana de "esta semana" es 3 días útiles, no 5. El corto plazo se vuelve aún más corto.
"Lo que se mide, se gestiona." Peter Drucker.
La consecuencia práctica para fijar metas. El trimestre sigue siendo útil como horizonte de cascada (ahí viven los OKR o el plan de área). El ciclo donde el equipo realmente revisa y ajusta es el mes. Tres a cinco metas mensuales con dueño y fecha, repensadas cada cuatro semanas, producen más resultados. El set trimestral que se redacta en enero y se vuelve a leer en marzo casi nunca aterriza.
Qué hace que una meta a corto plazo funcione
Muchos equipos fijan metas todos los lunes y las incumplen todos los viernes. El problema rara vez son las metas en sí. Es la estructura que las sostiene. Cuatro rasgos separan una meta que el equipo cumple de una que se vuelve un punto recurrente de reunión.
Un solo dueño por meta. No un equipo, ni un área, ni un canal de Slack. Una persona cuyo nombre aparece cuando la meta se atasca. "Marketing es dueño del volumen de demos" no es titularidad, es geografía. "Sara es la dueña del volumen de demos este trimestre" sí lo es.
Una fecha, no un trimestre. "Fin de Q3" suena específico pero funciona como etiqueta de lista de deseos. Para cuando se pasa, el equipo ya está pensando en el Q4. Una meta a corto plazo tiene una fecha en el calendario. Esa fecha es la que crea la presión real.
Una definición de "hecho" observable. "Mejorar el onboarding del cliente" no es medible. "Bajar de 9 a 4 días el tiempo entre el registro y el primer valor entregado" sí lo es. Una persona externa al equipo debería poder mirar la meta y el resultado y coincidir, sin necesidad de discutir.
Vive en el lugar donde el equipo ya trabaja. Una meta que vive solo en un documento de planeación se olvida para el miércoles. El chat del equipo, el tablero, el espacio compartido: ahí es donde sucede el trabajo, y ahí es donde la meta tiene que estar. Cuanto más lejos del día a día, menos probable es que sobreviva.
Cómo fijarlas en 5 pasos
El ejercicio completo cabe en 45 minutos cuando el equipo ya lo ha hecho dos veces. La mayoría de los equipos se salta los pasos 2 y 4, y por eso sus metas no se sostienen.
Encadenar desde el trimestre, no desde el correoPartir de los OKR del trimestre o del plan anual del área. Cada meta a corto plazo debe ser un paso visible hacia algo ya acordado en la altura superior. Una meta que no conecta hacia arriba es trabajo ocupado con fecha encima.
Fijar 3 a 5 metas por equipo, no 12Por encima de 5 metas por equipo por ciclo, el foco colapsa. Una lista de 12 metas se lee como un inventario de intenciones, no como un compromiso. Si todo es prioridad, nada lo es. El recorte es duro y necesario.
Asignar un dueño, escribir la fechaCada meta recibe un solo dueño humano y una fecha específica. "Sara, antes del 30 de abril". No "el área de marketing, fin de Q2". Aquí es donde fallan en silencio la mayoría de los sistemas de metas, y la falla pasa desapercibida durante semanas.
Definir "hecho" para que un externo lo verifiqueSi el equipo tiene que discutir si la meta se cumplió, la meta era vaga. Reemplazar "mejorar" por un número. Reemplazar "lanzar" por "disponible para todos los usuarios, con adopción mayor a X por ciento". La prueba es que alguien externo pueda decidirlo sin contexto.
Ponerla en la superficie que el equipo ya usaAnclar las metas donde el equipo empieza el día. En el espacio de trabajo, en el tablero kanban, fijadas al inicio del canal del equipo. Una meta que vive en un documento que nadie abre no es una meta, es un artefacto. Revisarlas 10 minutos cada semana y 30 minutos cada mes.
El paso con más palanca es el 3. Los equipos que asignan un solo dueño y una fecha concreta cumplen alrededor del 70 por ciento de sus metas a corto plazo. Los equipos que dejan cualquiera de los dos sin definir cumplen alrededor del 25 por ciento. La elección estructural hace más que el contenido mismo de la meta.
25 ejemplos por área
Los ejemplos están escritos como un equipo los pondría en su herramienta, con un dueño implícito por meta y contexto de equipos LATAM que sirven a clientes locales y transfronterizos. Tomar la forma, reemplazar los números con la realidad del propio equipo. El error clásico es copiar volúmenes que corresponden a otro tamaño de empresa.
Área
Cinco ejemplos de metas a corto plazo (1 a 90 días)
Ventas
Agendar 12 reuniones de descubrimiento con cuentas medianas de US y Canadá en 30 días. Enviar 50 correos personalizados por ejecutivo cada semana durante el próximo mes. Cerrar 4 contratos piloto antes del 30 de abril. Recortar 7 días el ciclo promedio de venta frente al trimestre anterior. Reactivar 6 cuentas estancadas y moverlas a la siguiente etapa en 45 días.
Marketing
Publicar 8 artículos del cluster SEO antes de fin de mes. Generar 200 solicitudes de demo desde pauta paga en 30 días con CAC por debajo de USD 80. Lanzar el newsletter del Q3 a 12.000 suscriptores antes del 15 de mayo. Conseguir 5 menciones en podcasts en 60 días. Bajar 10 puntos la tasa de rebote en las 3 landing principales en 45 días.
Operaciones
Bajar el tiempo promedio de resolución de tickets de 36 a 18 horas en 30 días. Documentar 5 flujos recurrentes en la wiki interna antes de fin de mes. Mover el 80 por ciento de la comunicación con clientes de WhatsApp al espacio de proyecto en 60 días. Cerrar el mes con 98 por ciento de entregas a tiempo. Hacer la auditoría de seguridad y cerrar los hallazgos críticos en 14 días.
Cuentas
Enviar un brief de kickoff en menos de 48 horas para cada cliente nuevo durante los próximos 30 días. Llegar a un health score de 9 sobre 10 en los 5 retainers más grandes al cierre del trimestre. Hacer la reunión mensual con los 12 clientes en cartera durante el próximo mes. Bajar 30 por ciento los tickets por scope creep frente al trimestre anterior. Conseguir 3 testimonios escritos y 2 compromisos de caso de éxito en 60 días.
Producto
Lanzar el formulario de onboarding a todos los usuarios antes del cierre del sprint. Bajar 15 puntos el abandono en el paso 3 del registro en 30 días. Alcanzar 90 por ciento de cobertura de pruebas en el módulo de autenticación antes de fin de mes. Hacer 8 entrevistas con clientes y sintetizar hallazgos en 14 días. Bajar de 23 a 8 bugs abiertos en producción al cierre del trimestre.
Dos patrones se repiten. Primero, las metas más fuertes no son las más ambiciosas, son las que tienen la definición de "hecho" más limpia. Segundo, casi todos los ejemplos combinan un verbo de acción ("lanzar", "publicar", "agendar") con un número y una fecha. Quitar cualquiera de los tres componentes debilita la meta.
Errores comunes
Seis fallas se repiten en la mayoría de los equipos que intentan operar un sistema de metas a corto plazo. Son fáciles de ver en retrospectiva, fáciles de pasar por alto mientras se está dentro del ciclo.
Metas que no terminan antes de la revisiónSi la meta no estará lista para la próxima reunión de revisión regular, es de mediano plazo. Forzar el corte. Si no, el equipo la trata como lista de deseos y la arrastra de mes en mes.
Métricas de vanidad sin resultado de negocio"Llegar a 10.000 seguidores" o "publicar 30 posts" solo cuentan si conectan con un resultado real. Una meta a corto plazo anclada en una métrica de vanidad cumple el número y no produce nada que el negocio pueda usar.
Fechas de fin de calendario"Fin de trimestre" y "fin de mes" no son fechas, son etiquetas. El trabajo se va a la última semana, se comprime y termina o por debajo del estándar o no termina. Elegir una fecha dentro del período, no el límite.
Sin ritmo de revisiónLas metas sin un check semanal se vuelven metas que se leen una vez al inicio del ciclo y otra al final. La mayoría de los equipos no fallan en el trabajo, fallan en el momento de corregir. Diez minutos a la semana alcanzan.
Lista sin compromisoUna lista de 12 metas donde el equipo coincide en que todas serían deseables no es un compromiso, es una declaración de intenciones. Por debajo de la línea de 3 a 5, cada meta se siente opcional. Cortar fuerte y comprometerse con lo que queda.
Sin conexión con el horizonte largoLas metas a corto plazo que no conectan con un objetivo trimestral o anual derivan en trabajo reactivo. El equipo entrega mucho y al final del trimestre nadie sabe qué se construyó. Encadenar o cortar.
Los primeros tres son errores de redacción (horizonte, métrica, fecha) y se notan en una semana. Los últimos tres son errores de sistema (ritmo, compromiso, alineación) y solo se notan al final del trimestre, cuando ya es tarde para corregir.
Qué recomendamos
Las metas a corto plazo funcionan cuando viven al lado del trabajo del día a día, no en una herramienta de planeación que nadie abre después del lunes. El error más común es tratar las metas como un artefacto de estrategia en vez de un ritmo operativo. Las metas terminan en una presentación, el trabajo sucede en otra herramienta, y la conexión entre ambos se evapora.
El patrón que aguanta en la escala de 5 a 50 personas, y especialmente en agencias LATAM con clientes locales y transfronterizos, es directo. Las 3 a 5 metas mensuales del equipo se anclan al inicio del espacio donde el equipo ya coordina. El dueño por meta es visible. La fecha es un día específico del calendario. La revisión semanal de 10 minutos pasa en el mismo espacio, en el mismo chat, con las mismas personas. Las metas no viven en un lugar separado.
Lleva tus metas a corto plazo donde el equipo ya trabaja.
Rock combina tareas, kanban y calendario con el chat del equipo en un solo espacio. Ancla las metas arriba, revísalas en el mismo chat, sin herramienta de planeación aparte.
Dos fallas a vigilar. La primera, el equipo escribe metas ambiciosas al inicio del ciclo y las olvida para la segunda semana. La solución es la revisión semanal de 10 minutos, no escribir mejor las metas. La segunda, el equipo apila metas mensuales encima de un set de OKR trimestral que nadie está usando tampoco. Si la capa trimestral está muerta, la capa mensual encima también lo estará. Conviene primero revivir la altura superior o saltarse los OKR y operar solo con metas mensuales durante dos trimestres.
Para la mayoría de las agencias y equipos de operaciones latinoamericanos, la capa mensual de metas es el sistema de planeación con mayor retorno por minuto invertido. Los OKR trimestrales y el plan anual importan, pero el trabajo o se ejecuta en la altura mensual y semanal, o no se ejecuta en absoluto.
Preguntas frecuentes
¿Qué es una meta a corto plazo en una empresa?
Una meta a corto plazo es un resultado específico, con un dueño y una fecha, que un equipo se compromete a entregar entre 1 y 90 días. Vive por debajo de los OKR trimestrales y los objetivos anuales. Es la capa donde la estrategia se convierte en trabajo que de verdad se cierra. Las que funcionan tienen un solo responsable, una fecha exacta y una definición de "hecho" verificable desde afuera.
¿En qué se diferencian de las metas SMART?
SMART es un criterio para redactar cualquier meta. Corto plazo se refiere al horizonte de tiempo. La mayoría de las metas a corto plazo deberían ser SMART, pero muchas metas SMART son de mediano o largo plazo. Las dos ideas responden a preguntas distintas: "¿está bien redactada esta meta?" y "¿cuándo tiene que estar lista?".
¿Cuántas metas a corto plazo debe tener un equipo a la vez?
Entre 3 y 5 por equipo por ciclo. Menos de eso, el equipo está sub-utilizado. Más de 5 y el foco colapsa: cada meta empieza a sentirse opcional. El recorte de 10 a 5 es la decisión con más palanca al fijar metas.
¿Son lo mismo que los OKR?
No. Los OKR suelen ser trimestrales, estructurados como objetivo más 3 a 5 resultados clave medibles. Las metas a corto plazo pueden ser una sola línea, mensuales o incluso semanales, y no requieren el formato OKR. En la práctica, las metas a corto plazo viven debajo de los OKR como la capa operativa que se desprende de cada resultado clave.
¿Cuál es un buen horizonte para una meta a corto plazo de empresa?
De 1 a 90 días. Por debajo de 1 día se trata de una tarea. Por encima de 90 días se vuelve mediano plazo y la urgencia que hace funcionar el corto plazo desaparece. El ciclo de 30 días es el más común en equipos LATAM, especialmente por la forma mensual del flujo de caja y la cobranza.
¿Con qué frecuencia conviene revisarlas?
Semanalmente con un check de 10 minutos y mensualmente con una revisión de 30. El check semanal detecta la deriva temprano. La revisión mensual revela patrones entre metas: quién está sobrecargado, qué tipo de meta el equipo falla siempre, si la forma misma de fijar metas necesita ajustarse.
¿Se pueden tener metas a corto plazo sin metas a largo plazo?
Se puede, pero el resultado es trabajo reactivo. Un equipo puede operar solo con metas a corto plazo durante algunos trimestres y producir mucho, pero sin un horizonte mayor del cual encadenar, las metas empiezan a derivar hacia lo que se siente urgente esa semana. Conviene combinar el corto plazo con al menos un objetivo trimestral una vez que el ritmo está instalado.
Las metas a corto plazo funcionan mejor cuando viven al lado del trabajo que las produce. Rock combina tareas, kanban y chat del equipo en un solo espacio, con un precio fijo y usuarios ilimitados. Empieza gratis.
Communication failure is the most expensive project risk on the table. The Project Management Institute estimates 29% of projects fail from poor communication. PMI also reports that $75 million of every $1 billion spent on projects is at risk from it. The PMBOK Guide puts the share of a project manager's time spent communicating at 75 to 90 percent.
A communication plan is the cheapest insurance against all of that. This guide covers what one is and the five essential elements. It also walks through six steps to build one, five template types, a worked example, and the pitfalls that quietly drain plans.
Quick answer. A communication plan is a written document that defines who needs what information, when, through which channel, and who delivers it. It turns ad-hoc updates into a predictable system instead of stakeholders chasing the team. The five essential elements are goals and objectives, stakeholders and audiences, key messages, channels and frequency, and roles and owners. A plan is the operational layer, not a strategy, a project schedule, or a stakeholder map. Most teams need one for any project running longer than two weeks, involving more than three stakeholders, or crossing time zones. Build it in six steps and review it at each milestone.
What is a communication plan
A communication plan is a written document that defines who needs what information, when, through which channel, and who delivers it. It turns ad-hoc updates into a predictable system. Stakeholders stop chasing the team, and the team stops over-explaining the same thing five times.
A communication plan turns ad-hoc updates into a predictable rhythm everyone can rely on.
It is not the same as a communication strategy. A strategy is the why and the long view (what voice we use, what we stand for, what brand of communicator we want to be). A plan is the operational layer (what we will send next Tuesday, to whom, in which channel). Strategies are written once a year. Plans get written per project, per launch, or per quarter.
Teams need a communication plan whenever the work runs longer than two weeks, involves more than three stakeholders, or crosses time zones. Distributed teams, agency-client work, product launches, and anything regulated all qualify. Most informal teams skip the plan and find out the hard way which decisions never reached the people who needed them.
What a plan is not: a project schedule, a status report template, or a stakeholder map. The plan touches all three but replaces none of them. It sits above them as the agreement on how the project communicates with itself and the world. It is the document everyone refers back to when something goes off the rails.
Every working communication plan answers the same five questions. Skip one and the plan starts leaking value within a week.
Element
What it answers
Example
Goals and objectives
What outcome should this communication produce?
"Keep the client aligned on weekly progress so scope changes are caught in week one."
Stakeholders and audiences
Who needs to know, and what is their level of detail?
Client lead (weekly summary), client exec (monthly), internal team (daily standup).
Key messages
What is the substance of each update?
Status, blockers, decisions needed, next milestones, risks.
Channels and frequency
How and how often does it land?
Async written summary every Friday, 30-min sync on milestone weeks, escalation by phone only.
Roles and owners
Who writes it and who signs off?
Account lead writes, project lead reviews, account lead sends.
The biggest mistake is treating these as separate documents. They are five columns of one plan, and they only work when they are seen together. A goal without a channel never reaches anyone. A channel without an owner gets skipped the first busy week.
The columns matter in this order too. Goals constrain the audience list (who actually needs this information?). The audience list constrains the messages (what do those people care about?). The messages constrain the channel choice (which medium fits what is being said?). Skipping ahead to channels (the most fun column to fill in) is how plans end up with weekly all-hands emails nobody reads.
How to create a communication plan in 6 steps
Six steps is the working baseline. A 30-minute session is enough to draft a plan that covers a quarter, longer for plans that cross multiple workstreams.
Define the communication goals5 minWrite 2 to 3 sentences on what this communication should produce. "Keep client aligned weekly" is a goal. "Communicate the project" is not. Goals decide everything downstream, so spend the time here before moving on.
Map stakeholders and audiences10 minList everyone who needs project information and group them by role: deciders, doers, influencers, observers. Each group gets a different cadence and a different level of detail. The stakeholder communication guide covers this in depth.
Pick channels by message type8 minMatch the channel to the message. Status updates: async written. Decisions needed: short sync call. Crisis: phone. Routine FYI: shared workspace. Document what goes where so the team is not guessing in real time.
Set the cadence and assign owners5 minLock the frequency for each audience group. "Weekly Friday by 5pm" is a cadence. "Periodic updates" is not. Name an owner for each thread. Without an owner, the meeting is everyone's responsibility, which means nobody's.
Document the plan where the work lives5 minPin the plan to the project space, not a separate Confluence page nobody visits. If team chat is in one app and the plan in another, the plan loses every week. Keep it next to the work.
Review at each milestone10 minA plan that never gets reviewed is a document, not a plan. At each milestone or monthly, take 10 minutes to ask what worked, what stakeholders complained about, and what should change. Update in writing.
Run your communication plan where the work happens.
Rock pairs team messaging with a task board, notes, and files so plans live next to the project, not in a separate doc. Flat $89/month, unlimited users.
Templates exist for the same reason recipes do: they keep you from reinventing the basics each time. Five types cover most projects. Pick the one that matches your situation and adapt.
A working communications plan template lists audience, message, channel, frequency, and owner in five columns.
Template type
Use case
Key fields
Default cadence
Project communication plan
Any project with a start, end, and multiple stakeholders.
Most teams need the first one. Agency teams running multiple clients usually run the first and third in parallel, with one shared template each stakeholder relationship adapts. Crisis plans are often skipped and most urgently missed exactly when needed, so pre-build them for the foreseeable situations.
A note on channel choice. Channel decides what gets read and what gets ignored, so match it to the message. Status updates and FYIs belong in async written form where they can be skimmed in seconds. Decisions needed belong in a short sync or a tagged thread with a clear deadline. Crises belong on the phone, no exceptions. Routine cadence belongs in a pinned doc inside the team's working space, not in an email thread that buries itself within a week.
Cadence is the other half. Once-a-week works for most project communication. Daily standups make sense for active sprint weeks but burn the team's attention if they run year-round. Monthly works for executive updates where the audience does not need granular detail. The right rule of thumb: cadence should match how fast the underlying work changes, not how visible the team wants to feel.
Communication plan example: agency client project
Here is a real-shape example for an 8-week brand redesign with a mid-size client. Three audiences: the client lead, the client exec, and the internal delivery team. The plan fits on one page.
Mapping stakeholders by influence and detail level is the highest-leverage step in a real plan.
Goal: Keep the client aligned on weekly progress and catch scope changes within the same week they happen.
Audiences and cadence: Client lead gets a written Friday summary with status, decisions needed, and risks. Client exec gets a one-paragraph monthly highlight at milestone weeks (2, 4, 6, 8). Internal team gets daily async standups and a 30-minute live sync on Mondays.
Channels: Friday summary in the shared client space as a pinned message. Monthly exec note over email. Decision-needed items go in a tagged thread in chat. Anything urgent goes by phone, no exceptions.
Owners: Account lead writes and sends the Friday summary. Project lead reviews before send. Account lead drafts the monthly exec note and the partner reviews. Each team member owns their own daily standup.
Review: At the week-4 milestone, the account lead asks the client lead what is working in the cadence and what they would change. Anything that comes up gets updated in the plan within 24 hours.
Most communication plans fail in predictable ways. Spot the pattern early and the fix is a paragraph; let it compound and you are rewriting the plan halfway through the project.
Over-engineering the planA 12-page plan with 8 audiences and 14 channels is a plan that nobody reads. One page is the working size. If it does not fit on a page, the plan is not the document, the document is the artifact of someone wanting to look thorough.
No named owners"The team will share weekly updates" is not a plan. The team is everyone, which means nobody. Every line in the plan needs a single name attached. If you cannot name an owner, the line is not ready to ship.
A static document nobody readsA plan written once in week one and never touched again is decoration. Plans need a review at each milestone (10 minutes is enough). If review keeps slipping, kill the plan and write a simpler one.
Wrong channel for the messageSending a decision needed in a public chat is how decisions get lost. Sending a status update over phone is how status reports get exaggerated. The channel decides what gets read and what gets ignored.
Plan lives separately from the workA plan in a Confluence page nobody opens does not survive. Keep it in the project space next to the chat and tasks. People should see it while they are doing the work, not only when they are hunting for it.
What we recommend at Rock
Most agency teams we see on Rock keep the communication plan as a pinned note inside the client space. It lives next to the project chat and the task board, which is the single change with the biggest payoff. Plans that live with the work get reviewed; plans that live in a separate doc get forgotten by week three.
When chat, tasks, and files share a space, the plan stops being a separate document.
The other shift we see work is treating the plan as five columns, not paragraphs. Audience, message, channel, frequency, owner. Five columns fits on a page. Paragraphs sprawl. The constraint forces decisions instead of hedging.
That said, the tool is downstream of the plan. The five elements and the six steps work in any stack, including a shared spreadsheet. If your team already has a system that fits on one page and gets reviewed at each milestone, the platform change is optional. If your plan currently lives in three different docs and nobody can find the latest version, consolidation is the cheaper move.
Three other patterns we see work on agency teams. First, a standing 10-minute communication review at every milestone (read out loud what the plan currently says, ask what to keep and what to change). Second, a single owner per audience group, named by name, not by title. Third, a written meeting agenda for any sync over 15 minutes, sent 24 hours ahead, with decisions needed listed at the top.
Frequently asked questions
What are the 5 elements of a communication plan?
Goals and objectives, stakeholders and audiences, key messages, channels and frequency, and roles and owners. Skip any one of these and the plan starts leaking value within a week. Most working plans fit all five on a single page.
How do you write a communication plan?
Six steps: define goals, map stakeholders, pick channels by message type, set cadence and owners, document where the work lives, and review at each milestone. A first draft takes about 30 minutes for a quarter-long project.
What is the difference between a communication plan and a communication strategy?
A strategy is the long-view why (voice, brand, audience principles). A plan is the operational layer (what gets sent next Tuesday, to whom, in which channel). Strategies are written once a year; plans get written per project or per quarter.
Which stakeholders should be involved in communications planning?
Every stakeholder with a role, decision authority, or material interest in the project should appear in the plan. Per PMBOK, inputs include the stakeholder register, the project plan, organizational process assets, and enterprise environmental factors. In practice: deciders, doers, influencers, and observers should all be mapped.
How often should you update a communication plan?
At each project milestone or once a month, whichever comes first. The review takes 10 minutes. Ask three questions: what worked in the last cadence, what stakeholders complained about, and what should change. Update in writing the same day, not "later."
Remote engagement looks different in 2026. Gallup's latest State of the Global Workplace report puts global engagement at 20%, an 11-year low. Fully-remote workers actually beat on-site peers (29% vs 20%), but that signal is fragile. Roughly 22% of remote workers report daily loneliness, and only 28% feel tied to their company's mission.
Engagement is not a perk problem. It is a manager problem, a clarity problem, and a recognition problem, and all three get harder over video. This guide covers what kills remote engagement, the eight practices that move the number, how to measure progress, and where Rock fits in.
Quick answer. Engage remote employees by combining clear weekly outcomes, structured 1:1s, async-default communication, and specific public recognition. The largest single lever is the direct manager, who Gallup credits with 70 percent of engagement variance. Engagement is not a perk problem. It is a clarity, manager, and recognition problem, and all three get harder over video. Fully-remote workers can beat on-site peers, but the signal is fragile when 22 percent report daily loneliness. Virtual activities, buddy onboarding, and team channels help, but only after the basics are in place. Start by fixing weekly outcomes and 1:1s.
Why remote engagement looks different in 2026
The remote conversation has moved past whether work-from-home is here to stay. Roughly 22% of the U.S. workforce will work remotely by end of 2026. Gallup's 2024 data shows fully-remote workers slightly more engaged (29%) than on-site peers (20%). The question now is how to keep that signal positive when teams are async, distributed, and under economic pressure.
Engagement on distributed teams depends on intentional practice, not ambient connection.
Three forces shape engagement when nobody shares a hallway. The first is mission-connection, with only 28% of fully-remote workers saying they feel tied to their company's purpose. The second is loneliness, where 22% of remote workers report daily loneliness, and engaged employees record 40% less loneliness on the Gallup index. The third is manager quality, which drives most of the engagement variance regardless of location.
None of this means remote is broken. Companies with structured hybrid or remote-first models report 20% higher engagement than firms that reverted to office mandates. The pattern across distributed-first companies (GitLab, Doist, Buffer) is the same: clear outcomes, generous async documentation, and intentional connection.
"People who have flexibility in where and when they work are actually more connected to their teams than those that are five days a week in the office." - Brian Elliott, co-founder of Future Forum
Chat and tasks in one space.
Rock pairs team messaging with a task board, notes, and files so distributed teams stop losing context across four apps. Flat $89/month, unlimited users.
Most engagement problems on distributed teams trace to a small number of recurring patterns. Spot them early and the fix is cheap. Let them compound and they leak the same way every quarter.
Meeting overload masquerading as connectionAdding more video calls when engagement dips. People stop turning on cameras, then stop replying, then quietly disengage. Calendar density does not create connection; intentional moments do. Read the virtual meetings playbook for a leaner cadence.
Unclear weekly outcomesWhen the team cannot articulate what a good week looks like, engagement drifts. Managers assume people know. People assume managers will tell them. Both lose, and the result is anxious overwork on the wrong things.
Recognition that lives in private DMsPraise in a 1:1 feels good for an hour. Praise where the team can see it shapes how everyone reads what good work looks like. Most managers default to the first because it is easier, and lose the cultural compounding effect of the second.
Manager-as-monitor instead of coachPinging "what are you working on?" twice a day signals you do not trust the work to happen without checking. Distributed teams need coach-mode, not watchdog-mode. The fix is fewer status pings and more outcome-focused 1:1s.
8 ways to engage remote employees
These are the practices distributed-first companies use. Each builds on the one before, so clear expectations come before recognition, which comes before culture-building. Skipping levels burns time.
1. Set clear weekly outcomes, not status updates
Engagement starts with knowing what good work looks like this week. Every person should be able to write down 2-3 outcomes by Monday, share them with their manager, and review them Friday. Outcomes beat status updates because they tie work to results, not to hours logged.
At Doist, where the team is fully async across 30+ countries, this lives in a public weekly priorities thread. At GitLab, it lives in a handbook page. The tool matters less than the rhythm. What kills it is letting weekly outcomes turn into another wall of tickets nobody reads.
2. Make 1:1s sacred and structured
Gallup found employees who meet regularly with their managers are three times more engaged than those who don't. The 1:1 is the single most important habit you can build for a distributed team. Keep it weekly, 30 minutes, and let the employee drive the agenda.
Skip status questions, since those belong in writing. Use the time for blockers, growth, and the things they would not say in a group call. Cancel only twice a quarter at most. If you cancel more, the meeting stops feeling sacred and you have lost the one ritual remote teams actually need.
"70 percent of the variance in team engagement is determined solely by the manager." - Jim Harter, Chief Workplace Scientist at Gallup
3. Default to async communication
Async cuts meeting load and makes engagement portable across time zones. Document decisions in writing, use threaded messages instead of meetings when possible, and reserve calls for ambiguity that text cannot resolve. The bar is: if you can write it down, write it down.
This takes investment. Async writing is a skill, response-time norms matter, and managers have to model both. The payoff is fewer broken evenings and a team that can do deep work. The async work guide covers the full playbook.
Async-first teams document agendas and outcomes in writing so context survives time zones.
4. Recognize publicly, specifically, and often
Recognition is the second-largest engagement driver after manager quality, and the cheapest one to fix. Only 26% of remote employees say they receive adequate recognition. Closing that gap moves the engagement number within a quarter.
Make it specific: "Maya shipped the migration two days early and unblocked the design team" beats "great work this week." Make it public, in a team channel where peers can react and add context. Make it frequent. Once a week per direct report is a reasonable starting cadence.
5. Design intentional connection moments
Forced fun is worse than no fun. What works is small, optional, and tied to people's actual interests. A 20-minute coffee pairing every two weeks. A quarterly half-day team retro. An offsite once a year if budget allows.
Avoid mandatory virtual happy hours at 5pm Friday. Engaged people show up. Disengaged people sit silently with their cameras off. Either way you have not changed anything, and you have used up an hour of trust the team will not give you back.
6. Onboard with a buddy and a 30/60/90 plan
New remote hires have it harder than office hires. They cannot read the room, overhear context, or grab someone for a five-minute question. The buddy system fixes most of this, so pair every new hire with a peer (not their manager) for the first 90 days.
Pair the buddy with a written 30/60/90 plan. Week 1: meet the team, ship one small thing. Day 30: own one process. Day 60: lead one project. Day 90: write a retro on what is working and what is not. The plan tells the new hire that you have done this before.
7. Invest in growth visibly
Remote employees need to see the path. In an office, growth is partly visible. You see who gets pulled into rooms, who runs the offsite. Remote, all of that is invisible. So make growth signals explicit: a quarterly skills-and-interests check, a personal L&D budget, public criteria for promotion.
This is also a retention play. Deloitte's 2025 Global Human Capital Trends report shows employees who can name their next step are dramatically less likely to leave. Read the feedback guide for how to run growth conversations that actually compound.
Lightweight polls turn engagement signals into something the team can see and act on.
8. Give the team the right tools
Engagement collapses under tool friction. If team chat lives in one app, tasks in another, and files in a third, people lose context every time they switch. The cognitive cost of context-switching is real and it compounds across a week.
Pick a stack where messaging, tasks, files, and meetings live close together. The fewer "where did we discuss that?" moments, the more energy goes into actual work. The remote work tools guide covers stack choices for small distributed teams.
How to measure remote engagement
Engagement is measurable. The mistake is to measure it once a year with a 50-question survey nobody trusts. What works is a small set of signals at a sensible cadence, paired with a readout where managers respond to what they hear.
Signal
What to track
Cadence
eNPS
"How likely are you to recommend this company to a friend?" 0-10 scale. Score = % promoters - % detractors.
Quarterly
1:1 themes
Recurring topics across all 1:1s. Watch for blockers, frustration patterns, and growth-signal drift.
Monthly review by manager
Async response time
Average time to first reply on threaded messages. Sharp spikes flag overload or disengagement.
Monthly
Recognition cadence
Number of public recognitions per direct report. Below one per week signals a manager habit gap.
Weekly review
Voluntary turnover
Resignations vs. team size, rolling 12-month window. Compare against industry benchmarks.
Quarterly
Manager confidence
"I trust my manager" on a 1-5 scale inside the quarterly survey.
Quarterly
The point of the table is rhythm, not perfection. Pick three of these signals, run them for two quarters, and you will know more than most companies who survey annually. Skip the "what is your biggest frustration" free-text field on the quarterly survey unless someone actually plans to read every answer.
What we recommend at Rock
From watching thousands of distributed agency teams use Rock, the highest-leverage move is collapsing the chat-tasks-files split. Most engagement problems are downstream of context loss. People do not know what is expected, what has been decided, or where to find last week's file.
Rock pairs team messaging with a task board, notes, and file sharing in one space. For agencies and small distributed teams, that means fewer tools, less context-switching, and one place where the work and the conversation around it live together. Flat $89/month for unlimited users is part of the story, but the engagement angle is really about the workspace shape.
That said, tools alone do not fix engagement. The eight practices above are what move the number. If you already have a stack that works, the tool change is optional. If you are bleeding people across four apps, consolidating is one of the cheaper engagement levers. It is also one of the few that pays back inside a quarter.
Engagement is built where the work lives, not in the calendar around it.
Frequently asked questions
How often should managers meet with remote employees?
Weekly 30-minute 1:1s is the working baseline. Gallup data shows employees who meet regularly with their manager are three times more engaged. Skip 1:1s rarely. Cancelling them signals the meeting is optional, which is the opposite of what you want on a distributed team.
Can remote teams be as engaged as in-office teams?
Yes, often more. Gallup's 2024 data showed fully-remote workers at 29% engaged versus 20% for on-site peers. The difference is that remote engagement is fragile. It depends on intentional practice (clear outcomes, frequent 1:1s, public recognition) rather than ambient connection through shared physical space.
How do you prevent burnout in remote employees?
Cut meeting load, set clear weekly outcomes so people stop overworking from anxiety, protect time off, and watch async response-time data for overload signals. The remote work stress guide covers the full pattern.
What tools help keep remote teams engaged?
Tools that reduce context-switching are the highest-leverage. A single space for chat, tasks, and files matters more than any standalone engagement app. Add eNPS survey tools for measurement and a public kudos channel for recognition. The smaller the tool stack, the better.
What is the single biggest driver of remote engagement?
Manager quality. Gallup attributes roughly 70% of engagement variance to the direct manager. Every other practice (recognition, 1:1s, clarity) runs through a manager who knows how to use them. Invest in manager development first, then add tools and rituals on top.
Most teams want to work async until the first big decision lands in a thread that takes three days to resolve. The promise is real, and so is the friction.
Async work is the practice of doing the work without expecting your teammates to be online at the same moment. It produces deeper focus, fewer meetings, and better documentation. It also produces decision lag, weak connection, and onboarding friction when the team has not built the habits that make it work.
This guide covers async work as it actually runs in 2026. The clean definition. The honest sync vs async comparison. The four benefits and five common pitfalls. A tools comparison sorted by use case. An honest take on when async fails. Take the quiz below to see where your team lands today.
Is your team ready for async?
5 questions to score your team on readiness for asynchronous work.
Quiz · 5 questions
Question 1 of 5
Async works when notes, tasks, and chat live in one place. Rock keeps decisions, work, and conversation together so people can catch up on their own time.
Quick answer. Asynchronous work is any work style where teammates do not need to be online at the same time to make progress. Context gets shared in writing or recorded video, and decisions happen on a longer cadence of hours to a day instead of in live meetings. A healthy mix for most knowledge teams is roughly 20 to 30 percent synchronous and 70 to 80 percent asynchronous. The payoff is deeper focus, fewer meetings, and documentation built as a side-effect. The cost is slower decisions, weaker connection, and harder onboarding. Start by replacing one recurring status meeting with a written update.
A healthy team mix is roughly 20 to 30 percent synchronous (meetings, calls, urgent chat) and 70 to 80 percent asynchronous (notes, tasks, threaded messages, recordings). The async-default model produces deeper focus and stronger documentation, at the cost of slower decisions.
What asynchronous work is
Async work is a methodology that treats team output like a relay race instead of a sprint. Each person picks up the baton when their focus window starts, runs their leg with full context handed off in writing, then hands off to the next person. The team does not need to be in the same room or even online at the same time.
The term was popularized in the 2010s by GitLab's all-remote handbook and Doist's Amir Salihefendić. The underlying ideas predate the term. Tom DeMarco wrote about uninterrupted focus in 1987's "Peopleware." Cal Newport coined "deep work" in 2016. What async added was a clear methodology for distributed teams: write decisions down, expect a 24-hour response window, default to documentation over meetings.
"Teams who try to go remote without putting in place tools, workflows, and norms for asynchronous communication will fail." - Amir Salihefendić, CEO of Doist
Async work is not the same as remote work, even though the two overlap. A remote team can be highly synchronous if everyone joins back-to-back video calls. A co-located team can be highly async if the office norm is uninterrupted morning focus blocks with chat checked twice a day. Async is about response cadence, not physical location.
Sync vs async at a glance
The two modes serve different purposes. Most teams need both. The trouble starts when the default is wrong: defaulting to sync when async would do, or defaulting to async when sync is actually the right tool.
Decision lag, loneliness, weak connection across the team
Documentation
Often skipped, key context lives in the meeting
Built in, context written before reply
Healthy mix
Around 20 to 30 percent of work
Around 70 to 80 percent of work
The healthy ratio for most knowledge teams is around 20 to 30 percent sync and 70 to 80 percent async. Teams that drift toward 80 percent sync end up in meeting hell. Teams that push past 95 percent async lose connection and start to feel like coworkers from different companies. The mix matters more than the absolutes.
Benefits of async work
Longer focus blocks. The single biggest benefit. When the team stops expecting an instant reply, people can sit with a problem for two hours instead of context-switching every six minutes. Cal Newport's research on deep work shows that uninterrupted focus produces disproportionately better thinking, not just more thinking. Async unlocks that.
Fewer meetings. Most status meetings can be a written note. Most "quick syncs" can be a Loom recording. When the team gets disciplined about which interactions actually need to be live, the calendar opens up. Microsoft's 2025 Work Trend Index found employees interrupted every 2 minutes during core work hours, 275 times per day. Async is the lever that cuts that number in half.
Real flexibility, especially across time zones. A distributed team in 5 time zones cannot effectively run on synchronous meetings without one zone permanently working at 11 PM. Async lets each person work during their best focus window. Parents pick kids up at 3 PM. Night owls do their best thinking at 10 PM. The team stays productive without anyone burning out from bad-hour calls.
Documentation as a side-effect. Async-default teams write things down because writing is how work moves. The decision happens in a doc, not a meeting. The status update is captured in a thread, not a chat message that scrolls past. Over time, the team builds an institutional memory that survives turnover.
Common pitfalls
Async work has well-known failure modes. Most teams that try it and revert to sync hit one of these. The honest take: every pitfall has a fix, but the team has to recognize the pattern before they can address it.
Loneliness and weak team connectionAsync cuts the casual interaction that builds trust. Without intentional replacement, the team starts to feel like coworkers from different companies. Schedule deliberate connection: weekly team calls, monthly retros, quarterly in-person time. The remedy is not less async, it is more intentional sync for relationship work.
Decision lagDecisions that needed a 30-minute call get strung out across 4 days of back-and-forth comments. The cure is naming when async stops: if a decision is not made by Tuesday, schedule a 20-minute call Wednesday. Define the escalation path before the back-and-forth becomes the bottleneck.
Documentation that decaysAsync only works if the written record is trustworthy. A 6-month-old playbook nobody updated is worse than no playbook because the team relies on wrong information. Assign one named owner per important doc. Review quarterly. Archive stale entries instead of letting them rot.
Onboarding new hires goes badlyWeek 1 of a new hire is the worst time to be async-pure. New people do not yet know what to search for, who to ask, or how the team writes. Give new hires more sync time in the first 30 days, including pairing sessions and live walkthroughs of the documentation. Then taper.
Loss of urgency for things that need itAsync culture trains the team to expect 24-hour response times. When a real urgency surfaces (security incident, client crisis, production outage), the team is slow to respond because everyone learned to ignore notifications. Define what counts as a real ping vs a normal message. Keep a thin sync channel for true emergencies.
The first three are habits (loneliness, decision lag, doc decay). The last two are scope (onboarding friction, urgency loss). Habit failures show up early and are fixable. Scope failures show up when the team uses async for the wrong situation. Both kinds matter, and a team that fails on either side stops trusting the practice.
Async tools by use case
The right tool stack depends on what kind of async work dominates. Most teams need a combination: one for chat, one for tasks, one for docs, one for recorded video. The table below sorts the common categories.
Tool
Category
Strength for async
Where it falls short
Rock
Workspace
Notes, tasks, and chat in the same space. Decisions get captured where the work happens. Cross-org spaces for clients and freelancers at no extra cost.
Not a dedicated async-video tool; not an enterprise wiki
Slack
Real-time chat
Channels, threads, integrations with everything
Sets a real-time expectation by default; messages scroll past
Twist
Async chat
Threads are first-class, no read receipts, no fake urgency
Smaller integration ecosystem than Slack
Loom
Async video
Replace meetings with 3-minute screen recordings
Video is harder to scan than written notes
Notion
Docs and wiki
Long-form async writing, structured knowledge
Not a chat tool; needs pairing with Slack or similar
Asana, ClickUp, Monday
Task management
Tasks with owners, statuses, async updates per task
Discussion happens in another tool
Two patterns stand out. First, most teams over-rely on Slack as the only async tool. Slack is real-time chat with async features bolted on; the default expectation is fast response. Twist or threaded workspaces produce better async behavior by design. Second, recorded video (Loom) replaces more meetings than most teams expect. A 3-minute Loom usually covers what a 30-minute status meeting would, with the bonus of being searchable later.
Async needs the right tools.
Rock pairs chat, tasks, and notes in one workspace so async actually works.
Async is a team discipline, not a tool choice. Three habits separate teams that make it work from teams that try and revert.
Write the decision down before you ship the work. The team's institutional memory is the document, not the meeting recording. If the decision lives only in a verbal conversation, it gets lost the moment someone new joins.
Define a default response time. Most teams land on 24 hours during work days. Urgent escalations have a separate, narrower channel. Without an explicit norm, people interpret silence differently and the system breaks.
Audit meeting hygiene quarterly. Every recurring meeting should pass a basic test: can this be a written update. If yes, kill the meeting and replace with the note. Doing this once produces nothing. Doing it every quarter compounds into a meeting-light culture.
"Async isn't about the work itself. Async is about being more respectful of your colleagues' time and creating an environment where deep focus is possible." - Darren Murph, former Head of Remote at GitLab
Teams that master async usually report the same surprise: the documentation they build for async ends up being the most valuable knowledge asset the company has. New hires onboard in days instead of weeks. Cross-team handoffs stop losing context. The work itself moves faster because the friction at handoffs disappears.
When async fails
Async is not the right default for every situation. Three contexts where forcing async produces worse outcomes than going synchronous.
Crisis communication. Security incidents, production outages, client emergencies. The team needs to coordinate in real time, run decisions in minutes not hours, and hold a shared picture of the moving situation. Keep a thin sync channel for true emergencies, and define what counts as one.
High-context creative work. Brainstorming, brand workshops, complex design critiques where the back-and-forth produces the result. Some thinking needs the bounce of live conversation. Async does not produce the same quality of creative output for these kinds of sessions.
New-hire onboarding week 1. A new employee does not yet know what to search for, who to ask, or how the team communicates. Pure async week 1 produces lonely hires who quietly disengage. Front-load sync time in the first 30 days, then taper as the new person learns the documentation.
The pattern: async is a default, not a religion. The team that runs async-first for most work and switches to sync deliberately for these three situations gets the best of both modes.
What we recommend
Most teams trying to go async fail because they change the tools without changing the habits. A new chat platform does not produce better documentation. A new task tool does not produce better decisions. The habits come first.
Pick one specific change to start. Replace one recurring meeting per team with a written status note. Define a default response time (most teams land on 24 hours). Build the documentation habit before scaling the practice. Sixty days of one habit beats six months of trying everything.
The pattern we see at Rock. The teams that get the most out of async use a single workspace where chat, tasks, and notes share the same room. Decisions get captured next to the work that produced them. Pinned notes in each project space hold the goals, stakeholders, and open questions.
The team chat sits above, the tasks alongside. New people get added to the space and find context in 10 minutes instead of 10 days.
"Employees are interrupted every two minutes during core work hours, 275 times a day on average." - Microsoft 2025 Work Trend Index
Rock is not enterprise BPM and not an async-video tool. There is no built-in Loom replacement and no 50,000-document semantic search. For 5 to 50 person agency and operations teams, the workspace approach produces better team-level async than buying three separate tools and integrating them. For larger organizations with formal governance needs, pair a workspace tool with dedicated async-video (Loom) and a structured wiki (Notion, Confluence) for long-form documentation.
Two failure modes to watch. First, the team adopts async tools but never updates the meeting cadence. The result is the worst of both worlds: chat plus all the meetings. Second, the team goes too pure too fast and loses connection. Schedule deliberate sync time for relationship work. Treat it as load-bearing, not optional.
FAQ
What is asynchronous work?
Asynchronous work is any work style where teammates do not need to be online at the same time to make progress. People share context in writing or recorded video, and the next person picks up the thread on their own schedule. Decisions, documentation, and task updates happen without scheduling a meeting.
What are examples of asynchronous communication?
Written status updates in a project space, a Loom recording instead of a status meeting, a comment thread on a shared doc, an issue or task with a clear description, a decision proposal posted for a 24-hour review window. Anything where the sender and the responder do not need to be online at the same moment.
What is the difference between synchronous and asynchronous work?
Synchronous work expects an immediate or near-immediate response, usually in meetings, calls, or live chat. Asynchronous work expects a response on a longer cadence (hours to a day) and happens in writing or recorded video. Most teams need both. A healthy mix is roughly 20 to 30 percent sync and 70 to 80 percent async.
What are the benefits of asynchronous work?
Longer uninterrupted focus blocks, fewer meetings, real flexibility across time zones, better documentation because context gets written down at the moment of work, and stronger thinking because written replies are more considered than verbal ones. The trade is slower decision cycles and the need for stronger documentation habits.
What are the disadvantages of asynchronous work?
Slower decisions, weaker informal connection across the team, documentation that decays if not maintained, and a tougher onboarding experience for new hires. Async also struggles with crisis communication and high-context creative work where bouncing ideas in real time produces better results.
What tools are used for asynchronous communication?
Notes and docs (Notion, Slite, Almanac), async-first chat (Twist), recorded video (Loom), task management (Asana, ClickUp, Monday), and workspace tools that combine chat and tasks (Rock, Basecamp). The right mix depends on team size and where current chaos lives. Most agency-scale teams need a workspace tool plus one async-video option.
How do you implement asynchronous work in a team?
Start with one specific change. Replace one recurring status meeting with a written async update. Establish a default response time (most teams land on 24 hours during work days). Define what counts as urgent enough to ping. Build the documentation habit before changing the meeting cadence. Audit progress after 60 days.
Is asynchronous work the future?
Async-default work is the trend at distributed teams, especially since 2020. The honest read is that fully async pure-play is rare; most companies blend sync and async. The right question is not whether async wins, but how much of your team's work should default to async. For most knowledge teams, 70 to 80 percent async is achievable and pays off in deep work and flexibility.
Async work needs notes, tasks, and chat in the same place. Rock pairs them in one workspace so context lives next to the work that produced it. One flat price, unlimited users, clients included. Get started for free.