What Is a Marketing Funnel? Stages, Metrics, and Where Yours Is Leaking
A marketing funnel is the model that maps how strangers become customers. Visitors arrive, some engage, fewer convert to leads, fewer still buy, and a smaller group sticks around. Every stage loses people. The plan that wins is the one that knows where the loss is biggest and what to do about it.
This guide covers what a marketing funnel is, the stages most teams use, and the metrics and conversion rates that flag a leak. It walks through the diagnostic for finding where your funnel breaks, the digital and B2B variants, and how the funnel sits inside the broader marketing plan.
What is a marketing funnel?
A marketing funnel is a model that breaks the customer journey into stages, from first awareness to repeat purchase, with conversion rates between each stage. The shape is metaphorical: more people enter at the top, fewer exit at the bottom. The model traces back to E. St. Elmo Lewis in 1898 and persists because it does one thing well: it gives marketing teams a shared language for where buyers drop off and a structure for diagnosing why.
The funnel is not a strategy. It is an analytical lens. The plan that uses the funnel decides what to do; the funnel tells you where to focus. A marketing plan without funnel thinking measures activity; a marketing plan with it measures movement through stages.
Funnel diagnostic
Top of funnel: monthly visitorsEdit any conversion rate in the diagnostic above. The stage that drops most below typical gets flagged automatically. The rest of this guide explains the stages, the typical rates, where most funnels actually leak, and how the digital and B2B variants change the rules.
The stages of a marketing funnel
Three-stage, four-stage, and five-stage models all describe the same shape. Pick what your team can measure consistently. The five-stage version below is the most common and covers retention as a marketing concern, which the older three-stage models ignore.
Awareness. The audience does not know you exist. The job is reach to people who match the personas. Reach is hard to attribute and easy to inflate; the leading indicators are branded search volume and engaged sessions on owned channels, not impressions on someone else's platform.
Interest (or Consideration upper). Visitors arrive and decide whether to spend more time. The first scroll, the first 30 seconds, the first headline either earns the next click or loses it. Most awareness work fails here, not at the top.
Consideration (or evaluation). Engaged users decide whether to identify themselves. They fill a form, download a resource, start a trial, or open an account. This stage is the most common leak in B2B because the offer-to-friction ratio is wrong.
Decision (or conversion). Leads decide whether to buy. The signals here are different per business: demo bookings for SaaS, pricing-page visits for services, cart-completion for ecommerce. Sales-and-marketing handoff cleanliness lives at this stage.
Retention (and advocacy). Buyers decide whether to come back, expand, and recommend. Most funnels stop at decision; the ones that compound treat retention as a marketing stage with its own KPIs and content.
Metrics and conversion rates by stage
The diagnostic value of a funnel comes from comparing your conversion rates against a reasonable typical range, not from staring at your own numbers in isolation. A 25 percent conversion looks fine until you learn the typical range is 35 to 45 percent for that segment.
| Stage | What to measure | Typical conversion | Leak signs |
|---|---|---|---|
| Awareness | Reach, impressions, branded search volume | n/a (entry stage) | Thin organic traffic, low brand search, paid not delivering reach |
| Interest | Engaged sessions, time on page, scroll depth past hero | 25 to 40% of visitors | High bounce, sub-30-second sessions, exit on the first scroll |
| Consideration | Form fills, content downloads, account creation, MQLs | 5 to 15% of engaged users | Engaged users do not convert, form abandonment, low CTA click-through |
| Decision | Demo bookings, trials started, purchases, SQLs | 10 to 25% of leads | Leads stall before buying, slow sales response, pricing-page bounce |
| Retention | Repeat purchase, expansion revenue, renewal, NPS | 50 to 70% of buyers | One-and-done buyers, low product activation, no expansion motion |
The ranges above are directional. B2B SaaS, B2C ecommerce, marketplaces, and services all run different absolute numbers. The discipline that matters is comparing your stages against your own historical rates AND a defensible external benchmark; teams that only do one or the other miss leaks.
"The most useful metaphor that people have found to describe a sales or conversion process is a leaky funnel." - Andrew Chen, partner, Andreessen Horowitz
Chen's frame is the right test for whether the funnel is doing its job. The model is useful precisely because it makes the leaks legible. A plan that pretends the funnel does not leak ships activity; a plan that names the leak ships fixes.
Where funnels leak and how to find the leaks
Every mature funnel has one or two stages responsible for 60 to 80 percent of total drop-off. The leaks are not evenly distributed. Find the worst leak first, fix it, then move to the next.
The diagnostic process is three steps. First, calculate the conversion rate at each transition (visitors to engaged, engaged to leads, leads to buyers, buyers to repeat). Second, compare each rate against a typical range and against your own historical baseline. Third, prioritize the stage with the largest gap from typical, not the largest absolute number of dropped people. A stage losing 10,000 visitors at a healthy 70 percent rate is fine. A stage losing 500 leads at a 5 percent rate when typical is 15 percent is the actual problem.
- Optimizing the wrong stage Most teams focus their fix energy on the top of the funnel because reach is easy to measure. Awareness is rarely the leak. Mature funnels lose 60 to 80 percent of total volume at one or two specific stages, usually consideration or decision. Find the leak before you spend a quarter chasing more visitors.
- Mistaking absolute volume for conversion rate A stage that loses 5,000 people sounds dramatic but might be perfectly normal. A stage that loses 30 percent of its predecessor when typical is 10 percent is the actual problem. Read your funnel in conversion rates first, absolute drops second.
- Skipping retention from the funnel Most funnels stop at decision because the marketing team owns up to that point and customer success owns after. The plan that compounds includes retention as a marketing stage, with expansion offers, referral motions, and reactivation campaigns. Funnels without retention model linear growth at best.
- No shared KPI dictionary across channels "Engagement" means something different to the social team than to the email team. "Conversion" is one number to paid and another number to content. The funnel rollup becomes a translation exercise the team eventually skips. Write one definition per metric and use it everywhere.
- Treating the funnel as the only model McKinsey's consumer decision journey, growth loops, and the flywheel critique are not wrong; they add nuance for businesses that compound through retention, network effects, or word of mouth. Use the funnel as a diagnostic lens, not a worldview. The stages are still useful for measurement; they are not the whole story.
The biggest of the five pitfalls above is the first. Most teams optimize the top of the funnel because reach is easy to measure. Awareness is rarely the leak. Mature funnels lose most of their volume in the consideration and decision stages; that is where the fix energy belongs.
Digital marketing funnel
A digital marketing funnel applies the same five stages to digital-only channels: SEO, content, social, email, paid search, paid social, display. The difference is that channels overlap. A buyer might first see you on TikTok, then Google your name a week later, download a guide from your site, get retargeted on LinkedIn, and convert from a branded paid search ad. Single-channel attribution misses 80 percent of that path.
The fix is shared funnel definitions across channels and an integration view that names which channels feed which stages. The full integration logic sits inside the digital marketing plan. Channel-by-channel deep dives live in the SEO marketing plan, content marketing plan, and social media marketing plan.
| Stage | Channels that earn this stage | Shared KPI |
|---|---|---|
| Awareness | Organic social, short-form video, paid social, display, PR, podcast guesting | Reach across channels combined |
| Interest | SEO content, YouTube, newsletter, LinkedIn thought leadership, retargeting | Engaged time on owned property |
| Consideration | Comparison pages, demos, case studies, webinars, paid search on bottom-funnel terms | Marketing-qualified leads |
| Decision | Branded paid search, sales sequences, pricing-page optimization, retargeting on cart abandonment | Closed-won revenue and assisted conversions |
| Retention | Customer email, in-app messaging, customer community, expansion content, referrals | Net revenue retention |
The shared-KPI column is the integration discipline. If three channels are funding the consideration stage, all three report the same definition of qualified leads, even if their tools call it something different. Without it, the cross-channel readout becomes a translation exercise.
B2B and SaaS marketing funnels
B2B funnels behave differently because B2B buying is collective and slow. Gartner research finds that buyers spend just 17 percent of their time meeting potential suppliers. A typical buying group has 11 to 20 stakeholders touching 27 channels on average before deciding. The funnel still applies; the math gets harder.
Three adjustments for B2B. First, account-level measurement matters more than person-level. A 12-person buying committee will show as 12 separate "leads" in the funnel; treating them as one account closes the gap. Second, stages widen: consideration in B2B is months, not days, with multiple touches and stakeholders. Third, retention is part of the funnel, not after it; expansion revenue and renewal are how SaaS economics actually work.
For SaaS specifically, the funnel often extends one stage further: aware → engaged → trial → paid → retained → expanded. The expansion stage has its own conversion rate, and it is the one most marketing plans skip. Tie it back to the broader marketing KPIs so the retention layer earns the same attention as acquisition.
The funnel's limits and modern critiques
The funnel is useful but not complete. McKinsey's consumer decision journey argues that buyers loop through evaluation, often re-entering at the consideration stage from existing customer relationships. The flywheel critique frames retention as the engine that powers acquisition through advocacy and word of mouth. Brian Balfour's growth loops describe businesses where one customer's action creates the next customer (referral, content, virality, paid recycling).
"Growth loops compound momentum, whereas funnels run out of fuel." - Brian Balfour, Reforge
Balfour's frame is the cleanest critique. The funnel models a one-way pipeline; loops model a self-reinforcing system. Both are useful at different scales. Use the funnel as a diagnostic lens for stage-by-stage measurement; use loops to design the retention and referral mechanics that compound. The plan that holds both is more honest than the plan that picks one.
What we recommend
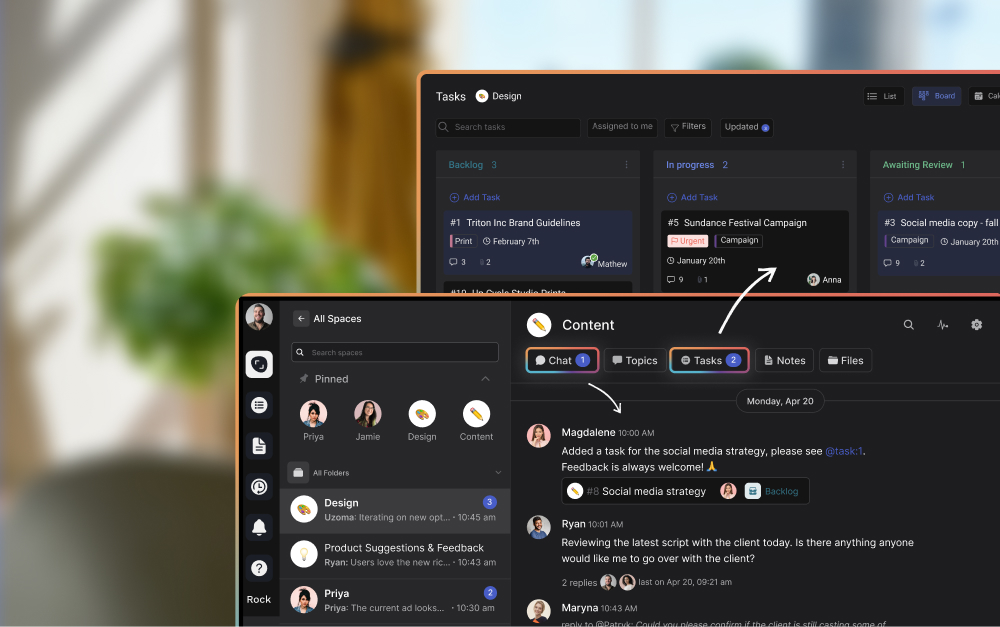
At Rock we run funnel diagnostics inside the same workspace where the team works. The funnel definition lives as a pinned note. Stage KPIs live as a board with one card per stage and the current rate visible. Weekly status check on the leading indicators, monthly readout against the full funnel, quarterly retro that decides which leak to fix next. The point of the diagnostic is not the dashboard; it is the conversation about which stage to attack next.
For agencies running funnels for clients, the diagnostic is also the cleanest selling artifact. Show the client where their funnel leaks against benchmarks, and the next month of work writes itself. The integration with the broader operating model sits in marketing operations for execution and campaign management when a campaign needs to lift a specific stage.
"Your customers' journeys are their stories, not funnels." - Bryan Eisenberg, author and conversion optimization expert (bryaneisenberg.com)
Eisenberg's frame is the right closer. The funnel is a tool, not a worldview. Customers do not experience their buying as five tidy stages; they experience it as a story with hesitations, returns, and recommendations. The funnel helps the team measure; the story is what the team designs against.
How to start using the funnel this quarter
If your funnel is unmeasured (most teams), do not try to instrument every channel and every stage in the first week. Pick the simplest version that gives you a leak signal, then improve from there.
Three moves to start this week. First, define the five stages in your specific terms (what counts as awareness, interest, consideration, decision, retention for your model). Second, pull the conversion rate at each transition for the past 90 days; spreadsheet is fine. Third, compare each rate against a typical range using the table above and the diagnostic widget at the top. The biggest gap is your priority for the next quarter.
Pin the funnel diagnostic where the team works, alongside the briefs and tasks that fix the leaks. Rock combines chat, tasks, and notes in one workspace. One flat price, unlimited users. Get started for free.


