By clicking Accept, you agree to the storing of cookies on your device to enhance site navigation, analyze site usage, and assist in our marketing efforts. View our Privacy Policy or manage preferences.
Oops! Something went wrong while submitting the form.
or continue with
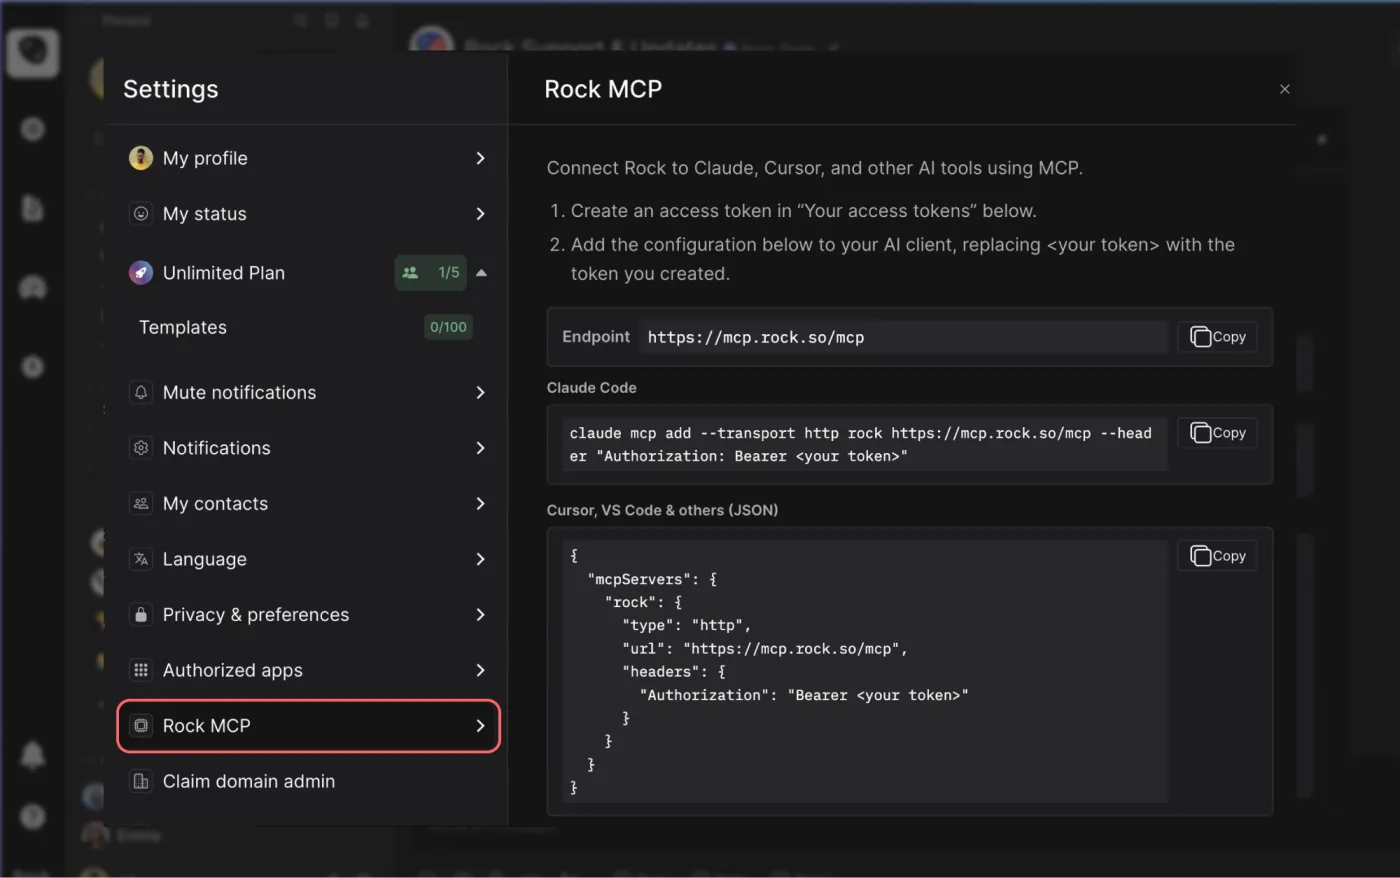
Rock MCP is here. You can now connect Rock to the AI tools you already use. Create a token in Rock, paste it into Claude, Cursor, or another client, and the assistant works inside your spaces as you, across all of them at once.
From earlier calls this month we learned that a lot of our active teams live in tools like Claude and Cursor now, and you would rather they reach into Rock than have you copy things back and forth. We work the same way.
Rock MCP is that connection: your AI assistant reads and updates your spaces directly, making it easier to stay up to date and manage projects across team members.
A few things worth knowing:
It works today with Claude Desktop, Claude Code, Codex, Cursor, VS Code, and Claude Cowork. A one-click connector for Claude on the web and mobile is coming next.
The token acts as you, read and write, across all your spaces. Treat it like a password, and revoke it any time.
It is on every plan, including Free.
Easiest setup: just ask Cowork
Claude Cowork can help you end-to-end with the setup. Share the prompt below and generate a new token, Claude will guide you through all steps.
Keep your token safe, never share in chat.
zsh
Works in coding environments
Add Rock MCP to Claude Code, Codex, Cursor, VS Code, or right from the terminal.
You will find it under your avatar, in a settings panel called Rock MCP. Full setup for every client is in the help guide.
What we use it for
A few of the things we ask it every day:
Search across your whole account. One question searches tasks, notes, and chat messages in every space you belong to. Try "where did we land on the Q3 pricing change?" or "find the onboarding brief and summarize it."
Turn a transcript or doc into tasks. Paste a meeting transcript or point it at a document, and ask it to create the tasks, with owners, due dates, and descriptions already filled in.
Push updates in. Drop your latest growth numbers, funnel metrics, or a status note straight into the right space, so the team sees it where they already work.
Run your to-do list from the chat. Ask "what is my most urgent task?", work on it together, then mark it done or update it without opening the app.
Plus, recent fixes
Since our last update, we also shipped:
Cleaner notifications and unread counts. Unread dots clear correctly for archived spaces and after "Mark all as read," and counts update the moment you open an item.
DMs in custom folders no longer disappear from your sidebar.
Chat threads stay in the right space now, with no more cross-space mix-up when you open one.
Add Spaces picker now targets the correct workspace inside embeds.
Jira is a project and issue tracking tool from Atlassian, originally built in 2002 as bug-tracking software for developers. It is now positioned as the dominant work management platform for agile software teams. If you have ever opened a ticket marked "blocker," joined a sprint planning meeting, or seen a backlog measured in story points, you have likely seen Jira at work.
This guide covers what Jira actually does, how the three Jira products differ, what it costs in 2026, and where it genuinely shines or breaks down. The goal is an honest take, not a marketing pitch.
Jira is the agile-first heavyweight. Most teams comparing it to alternatives are weighing depth and customization against simplicity and time-to-value. Here is a quick read of the field as of 2026.
Tool
Best For
Free Plan
Paid From
Jira
Agile dev teams, complex workflows
10 users
$7.91/user/mo
Rock
Chat + tasks, flat pricing
3 spaces, 5 members
$89/mo flat
ClickUp
All-in-one, deep customization
Unlimited members
$7/user/mo (AI extra)
Asana
Structured projects, Goals
10 users
$10.99/user/mo
Trello
Visual Kanban, simple workflows
10 collaborators per board
$5/user/mo
The choice usually comes down to two questions. How agile-mature is your team, and how much config time can you absorb before the tool earns its keep? If both answers are "very," Jira is hard to beat. Otherwise, simpler tools usually fit better.
What Jira actually does
Jira tracks work in units called issues. Issues can be bugs, user stories, tasks, or sub-tasks. Issues group into epics (larger bodies of work) and live inside projects. Teams move issues through customizable workflows on boards (Scrum, Kanban, or custom), break the work into sprints, and report progress through dashboards and burndown charts.
Atlassian sells three Jira products, all under the "Jira" brand as of 2026:
Jira Software. The flagship: agile project management for software development teams. Issues, sprints, backlogs, releases, version tracking, integrations with Bitbucket and GitHub.
Jira Service Management. ITSM and customer support workflows. Service request portals, incident management, SLA tracking, change management. Used by IT teams and increasingly by ops/HR.
Jira Work Management. The general-team version of Jira, blended into the main Jira brand in 2026 Atlassian positioning. Lighter views (lists, calendars, timelines) for marketing, ops, HR, and other non-engineering teams.
"Atlassian exists to unleash the potential in every team." - Mike Cannon-Brookes and Scott Farquhar, Atlassian Co-founders
The original Jira pitch was narrower: a better bug tracker for software teams. The platform has expanded steadily, and Atlassian's 2026 positioning emphasizes AI integration through their Rovo assistant, with workflows that connect to Confluence, Bitbucket, and 10,000+ apps in the Atlassian Marketplace. Whether that breadth is a feature or a complexity tax depends on the team using it.
Want a simpler alternative?
Rock pairs tasks with chat and notes in one workspace. One flat price, unlimited users.
Jira runs on per-user, per-month subscriptions. The free tier is generous for small teams; the Standard plan is the most common entry point; Premium adds cross-project automation and stronger security features. The full Atlassian pricing page covers the latest tier breakdown.
Jira Standard
What it costs as your team grows
$7.91/user/mo
Monthly cost
$119/mo
$1,424 per year
515 users200
Annual billing. Free for up to 10 users. Premium tier is $14.54/user/month with cross-project automation. Enterprise pricing is custom.
For reference, a flat-priced alternative like Rock is $89/mo regardless of team size ($5.93/user at this size).
The single biggest practical decision point: the free tier caps at 10 users. Teams that grow past 10 jump to Standard ($7.91/user/month) and the math changes fast. A 25-person team pays roughly $2,375/year on Standard. Premium doubles that. For comparison, Jira's free tier is the most generous in the agile-tools space, but the cliff at 10 users is what catches most growing teams.
If your team is 8-10 people today and likely to add 3-5 more this year, factor the cliff in upfront. Picking Jira and then watching the bill triple at month 11 is one of the more common regrets we see in PM tooling decisions.
Where Jira excels
Agile depth. Jira is built for Scrum and Kanban from the ground up. Sprint planning, backlog grooming, story points, velocity tracking, burndown charts: all native. No PM tool matches Jira's depth on agile ceremonies and reporting.
Workflow flexibility. Custom workflows with conditional transitions, validators, and post-functions let large teams encode their actual process in the tool. Combined with automation rules, Jira can replicate complex multi-stage approval processes that simpler tools cannot.
Integration depth. The Atlassian Marketplace has 10,000+ apps. Native integrations with Confluence (docs), Bitbucket (code), and increasingly with GitHub, Slack, Figma, and AI tools. For software teams already in the Atlassian ecosystem, the integration cost is near zero.
Reporting and dashboards. Real-time burndown, velocity, sprint reports, control charts, cumulative flow. Jira's reporting is more granular than any PM-tool peer. Engineering managers and program leads use this depth daily.
The honest trade-offs
The same depth that makes Jira powerful for mature agile teams makes it heavy for everyone else. The most-cited critiques from 7,500+ G2 reviews are remarkably consistent.
Steep learning curve. Jira's G2 ease-of-setup score is 7.5/10, the lowest in mainstream PM tools. First-time admins typically need 2-4 hours of configuration before their team can use it productively. Compare with Trello or Monday.com, where a team is moving cards within 10 minutes of signup.
Cluttered UI and slow page loads. Larger Jira instances feel sluggish. Important updates get buried in long ticket histories. Reviewers consistently mention the navigation feels overwhelming for occasional users.
Overkill for small teams. The setup cost only pays back at scale. For teams under 10 people, the time spent configuring Jira is often more than the time saved by using it.
"Too many people use Jira's breathtakingly incorrect definitions of story, epic, and task. It is one way that using Jira distorts your process away from agility." - Allen Holub, Software Architect and Agile Author
Holub's point is the deepest critique of Jira. The tool can shape, and sometimes distort, how teams think about agile work. The defaults are baked-in opinions about what a "story" or "epic" is. Teams that adopt Jira without examining those defaults end up with the tool driving the process instead of the other way around.
Jira's defaults are opinions about how agile work should look. They reward teams that match those opinions and frustrate teams that do not.
Or skip the learning curve.
Rock works out of the box: tasks, chat, and notes with no admin setup required. Free for small teams.
Jira is the right pick when four conditions line up. Your team is software development. You run formal Scrum or Kanban. You have someone comfortable maintaining the tool. And you have more than 10 people. The depth pays back at scale and the integrations slot into existing dev workflows.
Pick something else if any of these apply. Your team is under 10 people and likely to stay there. You do not run formal agile ceremonies. Your team is non-technical (marketing, ops, HR). Or you cannot dedicate someone to admin and configure the tool. Lighter alternatives like Rock, Trello, or Asana usually fit those teams better. For the head-to-head comparisons, see ClickUp vs Jira, Asana vs Jira, and Trello vs Jira.
Jira is built for engineering teams running genuinely complex, technical work. That is its strength. But on a team of under ten people, that same depth usually outpaces what you actually need. The configuration and upkeep start costing more time than they save. Match the tool to where you are now, not where you think you might be in two years.
Jira earned its position as the agile gold standard for a reason: nothing else matches the depth at scale. The catch is that "at scale" is doing a lot of work in that sentence. For most teams under 10, or non-engineering teams of any size, the cost of complexity outpaces the value. Match the tool to your team, not to the wishful org chart.
If Jira's complexity feels heavier than the work itself, a flat-priced workspace might fit better. Rock combines tasks, chat, and notes in one place, with cross-org collaboration and no per-seat tax. Get started for free.
The Salience Model is the framework most project managers reach for when too many stakeholders compete for attention and the team has to decide who matters right now. Three yes/no attributes (power, legitimacy, urgency) classify each stakeholder into one of seven types, and the type tells you whether to engage immediately, monitor, or filter out for now.
This guide covers what the Salience Model is and the three attributes that drive classification. It walks through the seven stakeholder types and how to engage each one. It also includes comparisons to other stakeholder frameworks and the mistakes that turn a good model into a static slide. Use the Salience Builder widget further down to map your own project's stakeholders.
The Salience Model is a stakeholder-prioritization framework that classifies stakeholders by three attributes: power, legitimacy, and urgency. It was introduced by Ronald Mitchell, Bradley Agle, and Donna Wood in their 1997 paper Toward a Theory of Stakeholder Identification and Salience, published in the Academy of Management Review. Stakeholders with all three attributes are Definitive (highest priority). Those with two are Expectant. Those with one are Latent. Salience is dynamic, so the classification needs re-running as the project context shifts.
The model fills a specific gap in stakeholder analysis. The Stakeholder Map is great for plotting everyone visually. The RACI Matrix is great for decision rights. The Salience Model is the priority lens that answers "if I can only call three stakeholders before the next meeting, who?"
Origin and Why It Works
Mitchell, Agle, and Wood developed the Salience Model in response to a specific problem in 1990s stakeholder theory. Earlier work (Freeman, 1984) defined stakeholders broadly as anyone affected by an organization's actions. That definition was inclusive but useless for prioritization: managers ended up with stakeholder lists of 30 or 40 names and no way to decide whose claim mattered most this quarter.
The 1997 paper solved this by introducing three observable attributes that combined to produce a salience score. The classification turned the abstract question "who is a stakeholder?" into the concrete one "who deserves attention right now, and why?" The model has been cited over 16,000 times in academic literature and is part of the Project Management Institute's standard stakeholder analysis toolkit. Its persistence is mostly due to the binary attribute design: yes/no questions force a clearer decision than 1-to-10 scoring scales.
The model is most useful in projects with many stakeholders and limited engagement bandwidth. Construction, public-sector projects, healthcare, and complex agency engagements are typical settings; for a 5-person internal initiative with three stakeholders, the framework adds overhead without much insight.
The 3 Attributes
The whole framework rests on three binary attributes. Each stakeholder either has the attribute or does not, and the combination determines the type.
Power. The stakeholder can influence the project's outcome, formally (org-chart authority, budget control, regulatory authority) or informally (coalition leadership, media reach, a coercive option). Power is "can they make us do something we would otherwise not do?"
Legitimacy. The stakeholder's claim is appropriate within the project's social, legal, or contractual context. Legitimacy does not require formal authority; a community affected by a planned development has legitimacy even without an org-chart title. Legitimacy is "do they have a reasonable basis to be heard?"
Urgency. The stakeholder's claim is time-sensitive or critical to them. Urgency has two parts: time pressure (regulatory deadline, contractual due date) and criticality (the issue matters intensely to the stakeholder). Urgency is "if we wait, does this become much worse?"
Salience Builder
Type a stakeholder name in each row, then toggle which of the three attributes each one holds: power (can influence outcomes), legitimacy (claim is appropriate), urgency (time-sensitive). The widget classifies each into one of seven types. Add rows below, copy the map when done.
Tip: Definitive stakeholders (all three attributes) deserve highest priority. Latent types (one attribute) need monitoring; their claim can escalate quickly if a second attribute becomes true.
0 stakeholders mapped
Solid map. Pin this list in your project workspace and assign owners for the Definitive and Dangerous stakeholders first.Try Rock for free
The widget above is the version we hand to project teams that want a working salience map in 5 minutes. Add stakeholder names, toggle the three attributes, and the widget classifies each into one of the seven types with an engagement hint. Reset to the example to see a worked map.
The 7 Stakeholder Types
The combinations of three binary attributes produce eight possibilities; subtract the "no attributes" case (non-stakeholder) and you have seven actionable types. Mitchell, Agle, and Wood group them into three tiers: Latent (one attribute), Expectant (two), and Definitive (all three).
Type
Attributes
Example
How to engage
Definitive
PowerLegitimacyUrgency
Project sponsor demanding a feature for a board deadline
Top priority. Immediate, sustained engagement; resolve the claim or escalate.
Dominant
PowerLegitimacy
Compliance team, executive committee, regulator without imminent deadline
Keep informed and aligned; they expect engagement and have means to insist.
Dangerous
PowerUrgency
Hostile press contact during a crisis; coercive lobbying group
Watch closely. Without legitimacy, may use coercion; address fast or risk disruption.
Dependent
LegitimacyUrgency
End-users awaiting a critical fix; community impacted by a project deadline
Their claim is valid and pressing but they lack power. Advocate or pair with a powerful ally.
Dormant
Power
Influential industry figure with no current claim against your project
Monitor. Can become Dominant or Dangerous quickly if their claim becomes legitimate or urgent.
Discretionary
Legitimacy
Long-term industry partner with general interest in the project
Engage selectively. No urgent need, but the relationship matters long-term.
Demanding
Urgency
Vocal social-media critic with no formal authority or obvious legitimacy
Acknowledge. Risk of becoming Dangerous if they gain power or legitimacy; do not ignore.
The most common mistake at this stage is over-investing in Latent types and under-investing in Dangerous ones. Latent stakeholders matter, but they are watch-list items, not active engagements. Dangerous stakeholders (power plus urgency, no legitimacy) are the ones who blow up projects in the news cycle. Their lack of legitimacy means they are willing to use coercion. Their power and urgency mean they have the means and motivation to do it now.
How to Engage Each Stakeholder Type
Classification without an engagement plan is paperwork. Each of the seven types needs a different posture, cadence, and owner. The patterns below are what we run on agency and project work; adapt to your context but keep the principle that engagement effort should match salience.
Definitive (all three attributes). Top priority. The project sponsor or regulator with imminent claims gets immediate, sustained engagement. Named owner at executive level. Weekly or daily touchpoints. Resolve the claim or escalate; do not let it sit.
Dominant (power plus legitimacy). Keep informed and aligned. Compliance team, executive committee, anchor client. Monthly steering committee at minimum, plus immediate escalation when scope or risk changes. They expect to be engaged; missing them creates trust damage.
Dangerous (power plus urgency). Watch closely; address fast. Hostile press contact, lobbying group, coercive vendor. Defensive engagement: clear, prompt, on-record responses. The goal is to prevent escalation and avoid giving them legitimacy through public conflict.
Dependent (legitimacy plus urgency). Advocate for them. End users awaiting a fix, communities affected by a project deadline. Pair them with a powerful ally inside the organization who can act on their behalf. Without that ally, their valid claims go unmet.
Dormant, Discretionary, Demanding (one attribute each). Watch list. Quarterly check-in or trigger-based monitoring. The trigger is the missing attribute: a Dormant stakeholder who suddenly has a legitimate claim becomes Dominant; a Demanding stakeholder who picks up power becomes Dangerous. Track the trigger conditions explicitly.
"Stakeholders' salience emerges from their interactions, not from individual attributes alone." - Aaltonen and Kujala, A multilateral stakeholder salience approach (2010 / 2021 extension)
Aaltonen and Kujala's extension to the original model is worth absorbing. Stakeholders rarely act alone; coalitions form, alliances shift. A Dormant stakeholder paired with a Demanding one can produce the equivalent of a Dangerous coalition without either party crossing a threshold individually. Track the relationships between stakeholders, not just their individual scores.
"Gaining and maintaining the support and commitment of stakeholders requires a continuous process of engaging the right stakeholders at the right time." - Lynda Bourne, Stakeholder Relationship Management
Bourne's framing is the practical complement to Mitchell's theory. Salience tells you who; Bourne's continuous-engagement principle tells you that the work is never done. The model classifies; the engagement plan operationalizes.
Salience Model vs Other Stakeholder Frameworks
The Salience Model is one of several stakeholder frameworks, and it answers a specific question. The table below shows where each framework belongs in your stakeholder toolkit.
Mapping proximity to the work; useful for communication frequency planning
The pragmatic stack we recommend works in three steps. Use the Stakeholder Map first to identify everyone visually. Then run the Salience Model to set priority among them. Then use a RACI matrix to assign decision rights on the engagement plan. Three frameworks, three different questions answered.
How to Apply the Salience Model in 5 Steps
The mechanics are straightforward; the discipline is in keeping the attributes binary and re-running the model as the project changes. Five steps separate teams that get value from the framework from teams that produce a static slide nobody opens.
List every stakeholder, not just the obvious onesPull names from the project charter, the org chart, regulators with jurisdiction, vendors, customers affected, internal teams downstream. Aim for 15 to 25 names on the long list. The Salience Model will filter; the job at this stage is exhaustive identification.
Score each on power, legitimacy, and urgencyMark each stakeholder yes/no on the three attributes. Power means they can influence the outcome (formally or informally). Legitimacy means their claim is appropriate within the project's social and legal context. Urgency means time sensitivity or critical importance to them.
Classify into the 7 typesThree attributes equal Definitive (top priority). Two equal Expectant (Dominant, Dangerous, or Dependent). One equals Latent (Dormant, Discretionary, or Demanding). Zero means non-stakeholder for now. The Salience Builder above does this classification automatically.
Decide engagement strategy per typeDefinitive and Dominant get sustained, high-touch engagement. Dangerous get fast, defensive attention. Dependent get advocacy from a powerful ally. Latent types stay on a watch list with a trigger condition (what would push them up to Expectant?).
Re-run the model when the project shiftsSalience is dynamic. A public incident can convert a Dormant stakeholder into Dangerous overnight; a coalition can convert Demanding into Dominant. Re-run the classification at least once per project phase, plus after any major change in scope, regulation, or external context.
The fifth step (re-running the model) is the one most teams skip. Salience is dynamic by design: a public incident, a coalition forming, a new regulation, a vendor failure can all change the classification overnight. Calendar a quarterly re-run plus a trigger-based one whenever the project's context shifts materially.
Common Mistakes
The patterns below show up across teams that adopt the Salience Model and lose value within one or two project phases. Most are about treating the framework as a slide deck rather than an operating exercise.
Confusing legitimacy with formal authorityLegitimacy is whether the claim is appropriate within the project's social and legal context. It does not require an org-chart title. A community group affected by a planned facility has legitimacy even without formal authority; ignoring them produces Dependent stakeholders that escalate to Dangerous.
Treating salience as staticSalience changes. A regulator with no current claim is Dormant; the same regulator with a public incident on file is Definitive overnight. Run the classification as a quarterly or per-phase exercise, not a one-time mapping.
Ignoring Demanding stakeholdersDemanding stakeholders (urgency only) get dismissed because they lack power and legitimacy. Mistake: they are one coalition or one news cycle away from gaining either. Acknowledge them; the cheap response now prevents the expensive one later.
Over-engineering the scoreSome teams turn the three yes/no attributes into 1-to-10 scales and weighted formulas. The model loses its bite when over-quantified. The yes/no version forces a clearer decision; binary attributes are the point of the framework.
Skipping the engagement-action stepIdentifying Definitive and Dangerous stakeholders without writing down who owns the relationship and what the engagement cadence is leaves the work undone. Each Expectant or Definitive stakeholder needs a named owner and a defined touchpoint frequency.
Using Salience without a complementary frameworkSalience tells you who matters most right now; it does not tell you what each person should DO on the project. Pair with a RACI matrix for decision rights and a Stakeholder Map for engagement strategy across the long tail. Salience is the priority lens, not the whole stakeholder system.
The biggest of these is treating salience as static. The whole point of the model is that the classification can change as the project unfolds; if your map is a one-time exercise from kickoff, you are managing yesterday's stakeholders. Re-run quarterly at minimum, and after every material context change.
What We Recommend
At Rock we run the Salience Model as a recurring 30-minute exercise pinned inside the project workspace. The output is a note with the seven-type classification. Each Definitive and Expectant stakeholder gets a named owner. Each Latent stakeholder gets a trigger condition (what would push them up the priority ladder). The classification updates at every phase gate, and tasks for the engagement plan live in the same workspace as the project work.
The reason for keeping the salience map inside the project workspace is the failure mode otherwise. Stakeholder maps that live in slide decks become decoration; they get reviewed at the start of the project and forgotten when the team is heads-down on delivery. A pinned note with the current map plus tracked tasks for each engagement keeps the model alive when it actually matters.
Pin the salience map inside the project workspace. Rock combines chat, tasks, and notes in one workspace. One flat price, unlimited users. Get started for free.
Most sales dashboards track 12 to 15 metrics across pipeline, activity, conversion, and revenue. The honest answer is that a B2B sales team only needs about six numbers, and one composite metric (Sales Velocity) compresses the whole engine's health into a single signal. Tracking 15 metrics in isolation produces noise; tracking the right six tells the team where to focus next.
This guide covers the six sales KPIs that actually predict revenue, with benchmarks for each. It introduces the auto-calculated Sales Velocity formula that turns four of those numbers into one headline output. The Health Check widget further down lets you plug your numbers in and see your dollars-per-day result.
Sales KPIs are the small set of metrics that connect sales activity to revenue outcomes. The six that matter for most B2B teams are quota attainment, pipeline coverage ratio, win rate, average sales cycle length, average deal size (ASP), and lead response time. Sales Velocity is the auto-calculated composite that combines four of those into a dollars-per-day output.
"Defining the sales methodology enables the sales training formula to be scalable and predictable." - Mark Roberge, The Sales Acceleration Formula
These metrics arrange in a hierarchy rather than a flat list. Pipeline coverage feeds win rate, win rate plus ASP feeds Sales Velocity, and Sales Velocity predicts whether quota attainment will land. Track the six in their proper layers and start with Sales Velocity as the headline number.
The 6 Sales KPIs That Predict Revenue
Each of the six below has a specific job. Together they tell you whether the engine is healthy, where it is leaking, and how much revenue it produces per day. The composite (Sales Velocity) is the headline; the inputs are where the team focuses to move it.
Quota attainment. The percentage of quota the team or rep achieves in a period. Healthy is 80% or higher across the team; below 65% is a process problem, not an effort problem. This is the board-level scorecard; track it monthly.
Pipeline coverage ratio. Qualified pipeline value divided by quota. The healthy band is 3x to 4x; below 2x means the team is mathematically unlikely to hit number this quarter regardless of how good closers are. Watch it weekly. This is the leading indicator that runs ahead of quota attainment.
Win rate by segment. Closed-won deals divided by total opportunities. B2B SaaS mid-market typically lands at 20% to 30%; SMB closes higher (often 30%+), enterprise lower (8% to 15%). Always segment; a blended company-wide win rate hides which motion is working and which is not.
Average sales cycle length. Days from opportunity created to closed-won. The healthy band for B2B SaaS is 46 to 75 days; longer cycles eat working capital, shorter cycles often mean qualification is loose. Cycle length is a velocity input: shorter cycles, all else equal, mean more revenue per quarter.
Average deal size (ASP). Total closed revenue divided by deals won. The SaaS median sits around $26,000 per the latest benchmark data, but ASP varies wildly by segment and motion. ASP is context, not a band; what matters is whether it is moving the way the strategy expects (up if you are moving upmarket, stable if you are scaling SMB).
Lead response time. Time from inbound lead arrival to first sales touch. Healthy is under 5 minutes; the conversion multiplier is real and large. Published research finds responding in 5 minutes vs 30 minutes is a 5x to 21x increase in conversion to qualified opportunity. Most teams know this and still let response time drift to hours. Build the alert into the workflow.
"Lead generation is what drives growth; salespeople are simply a conduit for that growth." - Aaron Ross, Predictable Revenue
Ross's framing is why pipeline coverage outranks closer skill on this list. A team with great closers and a 1.5x pipeline coverage will miss number every quarter; a team with average closers and a 4x coverage will hit consistently. The pipeline is the engine; the closing is the conversion of fuel into miles.
Benchmarks at a Glance
The table below shows healthy, watch, and fix bands for each of the six KPIs. Use it as starting calibration; B2B SaaS specifics are drawn from public benchmark data, and bands shift by segment and stage.
KPI
What it measures
Healthy
Watch
Fix
Quota attainment
Percent of quota the team or rep achieves in a period
80% or higher
65% to 80%
Below 65%
Pipeline coverage ratio
Qualified pipeline value divided by quota
3x to 4x
2x to 3x
Below 2x
Win rate
Closed-won deals divided by total opportunities, segmented
20% to 30% B2B SaaS
12% to 20%
Below 12%
Average sales cycle length
Days from opportunity created to closed-won
46 to 75 days B2B SaaS
30 to 100 days
Above 100 days
Lead response time
Time from inbound lead arrival to first sales touch
Under 5 minutes
5 to 30 minutes
Above 30 minutes
Sales Velocity
(Opportunities x win rate x ASP) / cycle length, expressed as $/day
Trending up quarter-over-quarter
Flat
Trending down
Two cautions on the bands. First, win rate ranges assume mid-market B2B SaaS as the baseline; SMB-only teams should expect higher (30%+), enterprise-only teams should expect lower (8% to 15%). Second, sales cycle length is shorter for self-serve and product-led teams (often 7 to 30 days) and longer for complex enterprise (90 to 180+ days). Compare against your own historical baseline before comparing against industry averages.
Sales KPI Health Check
Type your numbers and see where each one sits against B2B SaaS benchmarks. The auto-calculated Sales Velocity is the headline number that tells you how much revenue your engine produces per day.
Quota attainment (team avg)
Healthy: 80% or higher across the team
%
Type
Pipeline coverage ratio
Healthy: 3x to 4x of quota
x
Type
Win rate (B2B SaaS, mid-market)
Healthy: 20% to 30% by segment
%
Type
Average sales cycle length
Healthy: 46 to 75 days B2B SaaS
days
Type
Average deal size (ASP)
SaaS median: about $26K (varies by segment)
$
Type
Lead response time
Healthy: under 5 minutes; the conversion multiplier
min
Type
Sales Velocity (the headline number)opportunities x win rate x ASP / cycle length-
Type pipeline coverage, win rate, ASP, and cycle length to see your dollars-per-day output.
0 of 6 healthy
Solid sales engine. Track Velocity weekly alongside the inputs that move it.Try Rock for free
The widget above is the version we hand to teams that want to see how their inputs combine into Sales Velocity. The auto-calculated dollars-per-day output is the headline; the input rows tell you which lever to pull first. A 20% lift in pipeline coverage moves Velocity by 20%; cutting cycle length from 75 to 60 days moves Velocity by 25%. The widget makes those tradeoffs visible at a glance, which is the point.
Vanity Metrics Sales Teams Confuse for KPIs
Three numbers show up on most sales dashboards and do not belong as headline KPIs. Calls made and emails sent are activity metrics; they tell you the team is busy, not whether deals close. Demos booked measures inbound interest, not qualified pipeline. Total leads in CRM measures how full the database is, not how productive it is. The honest replacements live one or two steps down the funnel: opportunities created, MQLs converted, win rate by source.
The full pattern (and the way to clean up a sales dashboard that has drifted into vanity) sits in our vanity metrics deep dive. The shortcut here: if a number can move 50% next quarter without revenue or pipeline being measurably better, it is vanity, not a KPI.
How to Set Up Your Sales Dashboard
The mechanics are straightforward; the discipline is in keeping the dashboard at six metrics. Five steps separate the sales teams that get value from KPI tracking from the ones that pile up half-watched dashboards.
Start with Sales Velocity as the headlineSales Velocity is the single number that compresses the engine's health into one signal. Calculate it weekly using your current pipeline volume, win rate, ASP, and cycle length. Everything else on the dashboard either feeds Velocity or explains why it moved.
Track the four inputs that move itPipeline coverage tells you whether the top of the funnel is healthy. Win rate tells you whether qualification is working. ASP tells you whether the team is closing the right deals. Cycle length tells you whether the process is efficient. Move any one of those and Velocity moves.
Add quota attainment and lead response timeQuota attainment is the board-level scorecard; track it monthly. Lead response time is the conversion-killer hidden in plain sight. The difference between responding in 5 minutes vs 30 minutes is a 5x to 21x conversion multiplier per published research; track it daily and alert when the team drifts.
Segment the win rateA blended company-wide win rate hides the truth. Split it by deal size (SMB / mid-market / enterprise), source (inbound / outbound / partner), and rep tenure. Each cut tells you whether to invest in better leads, better qualification, or better closing.
Pin the dashboard inside the workflowA KPI dashboard that lives in a CRM or BI tool gets opened twice a quarter. Pin the same six metrics inside the workspace where the team chats and ships, with a Monday review on the calendar. The closer the metrics are to the daily pipeline conversation, the more likely the team will move them.
"Winning large customers is much more about causing a sale, not just catching one." - Trish Bertuzzi, The Sales Development Playbook
Bertuzzi's distinction (causing vs catching) is why pipeline coverage and lead response time outrank passive metrics like total leads. Causing a sale means actively engineering the pipeline through targeted outbound, fast inbound response, and disciplined qualification. Catching a sale means waiting for inbound and hoping the close cycle does the rest. The six KPIs above are designed to track the causing, not the catching.
Common Mistakes
The patterns below show up across sales teams that intend to track KPIs well and quietly drift back to activity metrics or vanity. Most are political or process problems, not analytical ones.
Tracking activity instead of outcomeCalls made, demos booked, emails sent, and meetings held are activity metrics, not KPIs. They tell you the team is busy, not whether deals are closing. Track them as inputs to coach behavior; never as the headline metric the dashboard reports up.
Reporting a blended win rateA 22% company-wide win rate hides the truth. SMB might close at 35%, enterprise at 8%, and the average tells nobody what to do. Always segment by deal size, source, and rep before reporting; otherwise the metric drives no decision.
Letting pipeline coverage drift below 3xPipeline coverage is the leading indicator that runs ahead of quota. Below 3x, the team is mathematically unlikely to hit number this quarter, no matter how good closers are. Watch coverage weekly; treat any week below 2.5x as a fire drill, not a wait-and-see.
Ignoring lead response timeStudies show responding to inbound leads under 5 minutes vs 30 minutes is a 5 to 21x conversion multiplier. Most sales teams know this and still let response time drift to hours. Build the alert into the workflow; do not rely on willpower.
Tying compensation to revenue aloneCompensation tied solely to closed revenue creates short-cycle, deal-at-any-cost behavior. Margin gets sacrificed for the close; the wrong customers come in. The cleaner pattern: compensation tied to a blend of revenue and either gross margin or LTV-adjusted contribution.
No owner per KPIWhen pipeline coverage is "the team's responsibility" and win rate is "everyone's job," nobody fixes the trend on the day it slips. Each KPI needs a single named owner whose quarter rides on it. Shared ownership is the same as no ownership.
The biggest of these is the activity-as-KPI trap. Sales managers often track calls and demos because they are easy to count and feel like they correlate with results. They correlate weakly at best; what predicts revenue is qualified pipeline coverage and win rate by segment. Coach activity at the rep level; report outcomes at the dashboard level.
What We Recommend
At Rock we run sales teams on a pinned KPI note inside the same workspace where pipeline reviews and call recordings live, with deals tracked in Tasks and weekly reviews happening in team chat. The six KPIs sit at the top with their bands; below that, each KPI links to the deals and tasks that move it. Owners post one-line updates on Mondays for any KPI outside its band, and quarterly recalibration retires anything the team has not acted on.
The reason for keeping the dashboard inside the workspace where pipeline conversations happen is the same failure mode that hits marketing and agency teams. CRM dashboards open twice a quarter at the all-hands; KPI notes pinned next to the deal-by-deal Monday review stay visible, get debated, and actually drive action.
Pair this with the broader cluster and the six KPIs become the connective tissue between effort and revenue. The marketing KPIs piece covers what feeds the top of the funnel (LTV:CAC ratio is the marketing-side composite that mirrors Sales Velocity here). The agency KPIs spoke covers service-business numbers if your sales motion is consultative; billable hours sits below as the operational input layer. The KPI framework covers the discipline of what counts as a KPI; vanity metrics covers what to cut. The OKR vs KPI bridge and OKR framework cover when to drive change versus hold a standard. Above the dashboard layer, SWOT, Strategic Choice Cascade, and PESTEL set the strategic direction.
Track the six alongside the pipeline that produces them. Rock combines chat, tasks, and notes in one workspace. One flat price, unlimited users. Get started for free.
You know the file you need, if only you could find it. The version is buried in someone's inbox, the latest is on a desktop, and the link in the email thread points at the second-most-recent draft. The whole problem is not the file. It is the system around the file.
This guide covers what file management actually is, the three types of file management systems, and a comparison of the six most-used tools today. The quick quiz below points you to the right tool for your team in about a minute, then the rest of the article unpacks the why.
Which file management system fits your team? · 5 questions~60 seconds
The folder structure is the visible part. The naming convention and the daily rhythm are what actually make file management work.
What is file management?
File management is the process of organizing, storing, retrieving, and sharing data files across a team or device. It covers how files are named, where they live, who can access them, and how the system survives someone leaving the team. Done well, file management is invisible: people find what they need in seconds. Done badly, it becomes the daily friction that costs around 19% of a knowledge worker's time just searching for and gathering information, according to McKinsey research.
The phrase covers two related things. The first is the personal file system on a single device: how you organize files on your laptop, what you name them, and how you back them up. The second is the team file system: a shared place where multiple people can find, edit, and version the same files without stepping on each other. Most workplace pain comes from the second.
"Your mind is for having ideas, not holding them." - David Allen, Author of Getting Things Done
The principle behind every good file system is the same as Allen's. The files exist to externalize what you cannot remember. The structure exists so you can find them again without thinking about it. Anything that adds friction to either step is broken.
Benefits of a file management system
The right file management system pays for itself in time saved on the boring stuff. The compounding effects matter more than any single feature.
Faster retrieval. The biggest cost of bad file management is search. A team with a clear structure and naming convention finds files in seconds. A team without one re-creates documents because finding the original takes longer than rewriting it.
Fewer duplicate versions. When everyone works from a single canonical link, there is no v1 vs v_FINAL_FINAL problem. The file management system is the version control system, not the filename suffix.
Easier handoffs. When a teammate leaves or rotates off a project, their files do not leave with them. Anything that lived on a personal drive stays accessible in the shared system.
Cleaner external sharing. A shared link to one canonical file is faster, safer, and clearer than emailing eight people the latest version. The link always points at the current draft.
Better security and audit trails. Modern file systems track who accessed what, when, and what changed. That matters more in regulated industries, but every team benefits from the version history when something gets accidentally deleted.
Centralized file management means the whole team works from the same canonical version of every file.
3 types of file management systems
Most file management systems fall into one of three patterns. The right pattern depends on where your team works and what you store.
Hierarchical (folder-based). The classic structure. Files live inside folders, folders live inside other folders. Tools: Google Drive, OneDrive, Dropbox, and the file system on your operating system. Best when the structure is stable and predictable. Weakest when files belong in two places at once, since folders are exclusive.
Cloud-native (link-and-search). Files live in the cloud and are found mostly through search and links rather than folder navigation. Tools: Google Drive search, Notion databases, Rock's linked files inside spaces. Best when search is good enough that you stop caring about folder hierarchy. Weakest when external collaborators expect a familiar folder tree.
Embedded (workflow-attached). Files live attached to the work they belong to: tasks, notes, conversations, projects. Tools: Rock attaches files to tasks and notes; Notion embeds them inside pages; Asana and similar attach to tickets. Best when the file is most useful in the context of the work it supports. Weakest when the same file needs to live in multiple workflows at once.
Most modern teams use a hybrid: a hierarchical system for archival storage, a cloud-native search layer for retrieval, and an embedded layer for active work. The hybrid is fine. What is not fine is having three different hybrids that nobody can describe in one sentence.
"Organize for action, not for category. Place a note or file not only where it will be useful, but where it will be useful the soonest." - Tiago Forte, Author of Building a Second Brain
File management makes async work easier
Strong file management is the foundation of asynchronous work. Async teams cannot rely on someone walking over to a desk to ask where the file is. Everything has to live somewhere predictable, named consistently, and shared with the right people without a follow-up question.
The rule of thumb: if a teammate in another time zone needs the file, can they find it without you? If the answer is no, you do not have file management. You have a personal system that other people happen to share. The fix is to centralize active project files in a single shared space, with a naming convention that someone joining tomorrow could understand without a tour.
Async teams live or die on file findability. The naming convention matters more than the folder tree.
Sharing files without losing track
The hardest part of file management is not storing files. It is sharing them and keeping the shared version connected to the conversation about it. Email attachments are the worst case: eight near-identical PDFs in five threads, with the latest version sitting in nobody's inbox.
The fix is one canonical link per file, hosted in a shared system, that always shows the current draft. Send the link, not the attachment. When the file is updated, everyone sees the new version automatically. For more on managing the email side of this problem, see our notes on email organization strategies and communicating with clients.
The harder version is sharing with people outside your organization, like clients and freelancers. Most file systems make this expensive (per-seat licensing) or messy (one-off email attachments). A few tools handle it cleanly through cross-org spaces or guest links. We come back to this in the tools section below.
"Workflow for a knowledge worker is about sharing ideas, moving projects forward, getting aligned on the same page." - Aaron Levie, Co-founder and CEO of Box
External sharing is the hardest part of file management. Cross-org spaces let clients join without per-seat licensing.
6 file management systems compared
Below is an honest side-by-side of the six most-used file management tools as of 2026, with a real recommendation for each. The quiz at the top of the article maps your team profile to one of these. The H3 sections after the table cover the trade-offs in more detail.
Tool
Free tier
Best at
Best for
Skip if
Rock
Unlimited messages, files, and tasks; 250 MB per file; 5 members per space
Combining chat, tasks, and files in one space; cross-org collaboration with clients
Agencies and small teams that mix internal and client work
You only need raw storage with no chat or tasks layer
Google Drive
15 GB across Drive, Gmail, and Photos
Real-time collaboration on Docs, Sheets, and Slides
Teams already in Google Workspace, document-heavy work
You handle large media or design files where sync is slow
Dropbox
2 GB free, 3 devices max on Basic plan
File sync across machines, large media handling, external link sharing
Design, video, and creative agencies with heavy media files
You mostly produce documents and spreadsheets
OneDrive
5 GB free, more bundled with Microsoft 365 plans
Tight integration with Office, Teams, and Windows
Microsoft 365 organizations with Teams as the chat layer
You are not on Microsoft 365 already
Smartsheet
30-day free trial, then paid only
Spreadsheet-style project sheets with file attachments
Project teams that want Gantt-style work tracking with files attached
You need general file storage, not project tracking
Notion
Generous personal free tier; 5 MB file upload limit
Files embedded inside structured wiki pages and databases
Knowledge-base-first teams with light file storage needs
You handle large binary files or need a folder hierarchy
1. Rock
Rock combines chat, tasks, notes, and file management in a single workspace. Files attach to tasks and notes, conversations stay connected to the file they reference, and external collaborators can join through cross-org spaces without paying per seat. Free tier covers unlimited messages, files, and tasks for up to 5 members per space.
Best for agencies, freelancers, and small teams that mix internal and client work. Skip if you only need raw storage with no chat or task layer; a dedicated tool like Drive or Dropbox will be lighter.
2. Google Drive
Google Drive is the default for teams in Google Workspace. Strong real-time collaboration on Docs, Sheets, and Slides. The 15 GB free tier is generous; paid plans start at a few dollars per user per month. Search is excellent, which means folder hierarchy matters less.
Best for document-heavy teams already inside Gmail and Google Workspace. Skip if you handle large media or design files where Drive sync is slow and unreliable.
3. Dropbox
Dropbox built its reputation on a strong file sync engine. It remains the favorite of creative teams handling large media files, with reliable selective sync and solid external link sharing. The 2 GB free tier is tight, so most teams move to paid quickly.
Best for design, video, and creative agencies with heavy media files. Skip if most of your work is documents and spreadsheets that Drive or Microsoft handle natively.
4. OneDrive
OneDrive is Microsoft's file storage layer, deeply integrated with Office, Teams, and Windows. Free with Microsoft 365 plans (5 GB free standalone). The integration with Teams as the chat layer makes it the natural pick for organizations standardized on Microsoft 365.
Best for Microsoft 365 organizations using Teams. Skip if you are not already on Microsoft 365: the standalone OneDrive experience is weaker than Drive or Dropbox.
5. Smartsheet
Smartsheet is spreadsheet-style project management with file attachments built in. Files attach to rows in the project sheet, which keeps documents tied to the work they support. The 30-day free trial is the only free option; pricing is paid-only after.
Best for project teams that want Gantt-style work tracking with files attached. Skip if you need general file storage without the project-tracking layer.
6. Notion
Notion is knowledge base and wiki first, file management second. Files embed inside structured pages and databases, making it strong for teams that want files attached to context rather than living in a folder tree. Free personal tier is generous; team plans start at a few dollars per user per month.
Best for knowledge-base-first teams with light file storage needs. Skip if you handle large binary files or need a traditional folder hierarchy: Notion is wiki-shaped, not file-shaped.
Common mistakes to avoid
Most file systems fail in the same handful of ways. None is about the tool choice. They are about the discipline of naming, sharing, and committing to a single canonical version.
Folder porn instead of working filesSpending two hours building a 30-folder taxonomy and then never using the inbox of new files. Most teams need 4 to 8 top-level folders, not 40. Start small and add a folder only when the same kind of file lands twice with nowhere obvious to go.
No naming conventionWhen every person names files differently, search becomes the only navigation. That is fine until search starts returning a dozen files that look identical. Pick a naming pattern (project-date-version, or client-deliverable) and put it in writing. The exact pattern matters less than the consistency.
Personal drives mixed with team drivesFiles saved to someone's personal drive disappear when they leave or change roles. Team-shared drives (or spaces) are the place for anything two or more people will need. Set the default at "shared" and treat personal as the exception.
Sharing scattered across email attachmentsEight versions of the same deck circulating in five email threads is not file management. Anything you would resend more than once belongs in a shared space, with a single canonical link that always shows the latest version. Email attachments are for one-shot deliveries, not for ongoing collaboration.
No version-control habitSaving files with v1, v2, v_final, v_final_FINAL is a version control system. It is just a bad one. Use the built-in version history of whatever tool you are on (Drive, Notion, Dropbox, Rock all have it). Stop adding "v_FINAL" to filenames. The tool already remembers.
The smallest team can run a file management system that scales. The largest team can be drowning in v_FINAL_v3 chaos. The difference is whether the team has agreed on a naming convention, picked a default tool for shared files, and built the habit of sending the link instead of the attachment. The tool is downstream of the habit.
Files belong with the work they support. Rock combines chat, tasks, notes, and file management in one workspace, with cross-org collaboration built in. One flat price, unlimited users. Get started for free.
Slack and Microsoft Teams are the two largest team chat tools in 2026. Most teams shopping for one have already heard of both. The hard question is not which is "better." It is which fits your existing stack, your budget, and how your team actually works. Both are competent products, both ship serious AI features, both have spent the last two years adding pieces to compete with each other. The right pick depends on the conditions of your team, not the headline features.
This guide compares them axis by axis, runs the real cost at 10, 25, and 50 seats, and covers the late-2025 Microsoft Teams unbundling that most ranking comparison articles still miss. Some teams should pick Slack. Some should pick Microsoft Teams. And some should pick neither because the answer is a chat-first workspace that does not lock you into either Salesforce or Microsoft. Run the recommender below for a starting point.
Slack and Microsoft Teams ended up in similar places by 2026. Channels, threads, video, and AI. The difference is the stack each one anchors to.
Quick answer. Slack is chat-first, Salesforce-owned, and integration-deep. Microsoft Teams is Microsoft-stack-native, Copilot-driven, and the obvious fit for teams already on Microsoft 365. Pick Slack if your team lives outside the Microsoft ecosystem and values the deepest integration directory. Pick Microsoft Teams if you already pay for M365 and want chat next to Outlook, Word, and Excel. Pick neither if you want chat with tasks and notes in one workspace, at flat pricing, without locking into either platform.
Want chat without the per-seat tax?
Rock pairs messaging with tasks and notes in one workspace. Flat price, unlimited users.
Slack launched in 2013 and made channels and threaded chat the standard for team communication. Salesforce acquired the company in 2020. The product has stayed close to the original idea: chat is the workspace, and everything else is a deep integration on top. The 2026 lineup has grown beyond chat alone.
The current feature set covers channels, threads, group huddles, Canvas (collaborative documents inside Slack), Lists (lightweight project tracking), and Slack Connect for cross-organization channels. Slackbot is now context-aware, pulling answers from channels, canvases, and Salesforce records when grounded with permissions. Agentforce agents run inside Slack threads for sales and support workflows. The integration directory has 2,600+ apps, the deepest in the category by a wide margin.
"Knowledge work has been crushed by the hyperactive hive mind workflow." - Cal Newport, Author of A World Without Email
Newport's line is the honest critique of how Slack is sometimes used in practice. The tool itself is not the problem. The team norms around it are. Slack works well when teams use channels to keep work visible and asynchronous. It becomes the hyperactive hive mind when the same teams treat it as instant-messaging-with-CC-everyone. The product offers structure (channels, threads, statuses, Do Not Disturb) but does not enforce it.
The big 2025 shift was AI pricing. Slack killed the standalone Slack AI add-on (which was $10 per user per month) and bundled the same features into every paid tier mid-year. So Pro, Business+, and Enterprise+ all now include AI message summaries, channel recap, and search-grounded answers as part of the base price. This makes the Slack vs Microsoft Teams cost comparison meaningfully different from articles published before May 2025.
Microsoft Teams launched in 2017 as Microsoft's answer to Slack. The product grew into the largest enterprise collaboration platform almost entirely by being bundled with Microsoft 365. That free distribution model ended in late 2025, which we cover separately below. The product itself has matured into a full collaboration suite. Chat channels, video meetings with recording and transcription, file storage via OneDrive and SharePoint, document collaboration through Loop, and tight integration with the rest of Microsoft 365.
The 2026 release pushed AI deeply into the product. Microsoft 365 Copilot Chat now lives inside Teams chats, channels, calls, and meetings on Windows, Mac, and Web. Mobile rollout is in progress. Video meeting recaps generate narrated highlight reels, not just transcripts. Smart scheduling proposes meeting times across attendee calendars. Teams Premium is the upsell layer for advanced security, intelligent recap, and webinar tooling.
Microsoft Teams sits at the center of Microsoft 365. The fit is seamless if your team already lives in Outlook, Word, and Excel.
Where Microsoft Teams shines is integration with the rest of Microsoft 365. Outlook calendar invites become Teams meetings in one click. Word documents open inline for collaborative editing. SharePoint files surface in channel tabs. Power Automate flows trigger from Teams events. For organizations already standardized on Microsoft 365, the friction to adopt Teams is close to zero.
Where Microsoft Teams struggles is outside that ecosystem. Teams Connect (the equivalent of Slack Connect for cross-org chat) is functional but less mature than Slack's. The integration directory exists but is shallower than Slack's. And the unbundling decision changed the economic calculus, which we cover next.
Slack vs Microsoft Teams side-by-side
Six axes matter when picking between these tools in 2026. Channels and threading, video, AI strategy, integrations, security and compliance, and pricing. Here is how each one stacks up.
Feature
Slack
Microsoft Teams
Owned by
Salesforce (since 2020)
Microsoft
Built around
Channels and threaded chat
Teams, channels, and Microsoft 365 integration
Best for
Companies that lead with chat, often Salesforce-stack
Companies already on Microsoft 365
Channels and threads
Strong, mature threading model
Channels with newer threading, less polished
Video and meetings
Huddles, screen share, basic meetings
Full meetings platform with recording and transcription
AI in 2026
Slack AI bundled in all paid tiers (was $10 add-on, killed mid-2025); Agentforce agents
Copilot is a separate $18-21/user/mo add-on
Integrations
2,600+ apps in directory; deepest ecosystem
Microsoft 365 native, plus growing third-party
Free plan
90-day message history, limited integrations, no group huddles
Limited, capped on most features
Paid from
Pro $7.25/user/mo (annual)
Teams Essentials $4/user/mo (rises to $4.50 July 2026)
Higher tier
Business+ $12.50/user/mo
M365 Business Standard $12.50/user/mo (rises to ~$14.50 July 2026)
Lock-in
Salesforce orbit
M365 dependency (less so since Nov 2025 unbundling)
Mobile
Strong, near desktop parity
Strong, especially inside M365 ecosystem
Compliance and security
Strong, especially on Enterprise+
Best in class for regulated industries
Channels and threading
Slack wins on threading depth. Threads were a first-class feature from the early days. The pattern is well-established: a channel holds the conversation flow, and threads keep replies organized so a fast-moving channel does not bury context. Mature teams build cultures around threading discipline.
Microsoft Teams threads work, but the model is newer and the conventions less mature. Channel posts have a clear "reply in thread" affordance, but the experience does not feel as natural to teams that came up on Slack. For users coming from email, Teams' channel layout reads as more familiar. For users coming from chat-first products, Slack feels closer to home.
Both tools support direct messages, group DMs, mentions, and reactions. The basics are at parity. The difference is in how teams actually use channels day to day.
Video and meetings
Microsoft Teams wins on video. The platform was built around meetings as a first-class object: scheduled events, persistent meeting chat, recording, transcription, breakout rooms, and now AI-generated highlight reels. For organizations that run formal meetings often, Teams is closer to a full meeting platform than a chat tool that hosts video.
Slack offers Huddles (lightweight ad-hoc audio and video) on most paid tiers, plus longer scheduled meetings on higher tiers. Huddles are great for quick syncs without scheduling overhead. They are not a replacement for a dedicated meeting platform. Teams that pick Slack often pair it with Zoom or Google Meet for formal meetings.
For teams running heavy meeting volume, Teams covers more ground in one tool. For teams that prefer async-first work and use video sparingly, Slack plus a separate meeting tool is fine. See our Zoom vs Google Meet comparison for the standalone-meeting-tool decision.
AI strategy in 2026
This is where the two products diverge sharply. Slack went all-in on bundling AI into base plans. Microsoft Teams kept AI as a separate paid add-on through Copilot.
Slack AI was a $10 per user per month add-on through 2024. In mid-2025 the company killed the add-on and bundled the features into every paid tier. So at $7.25 per user per month on Pro, you now get message summaries, channel recap, search-grounded answers, and Canvas AI editing. Agentforce agents extend this for Salesforce-stack teams.
Microsoft Teams keeps Copilot as a separate add-on at $18 to $21 per user per month, layered on top of whichever Microsoft 365 plan you already pay for. So a 25-person team on M365 Business Standard plus Copilot is paying $14.50 plus $21 per user per month, totaling roughly $35 per user. The all-in cost is meaningfully higher than Slack's bundled approach.
The trade-off is feature depth. Microsoft Copilot is the more capable assistant when grounded across the full Microsoft 365 corpus (Outlook, Word, Excel, SharePoint, OneDrive, Teams). Slack AI is more limited in scope but cheaper and easier to evaluate. For teams where AI is critical, the question is whether Copilot's depth is worth the per-user surcharge.
Integrations
Slack wins on breadth. The integration directory has over 2,600 apps including most major SaaS tools (Salesforce, Jira, GitHub, Zoom, HubSpot, Notion, Linear, Figma). The integrations are typically deeper than what Teams offers because Slack has been the default chat tool for SaaS-first companies for a decade.
Microsoft Teams has a growing app directory, but the mix skews toward Microsoft-friendly tools and enterprise compliance partners. The native integrations with the rest of Microsoft 365 are unmatched. Outlook, OneDrive, SharePoint, Power Platform, and Dynamics all connect natively. Third-party integrations are functional but not as deep as Slack's equivalents.
For a team that lives in SaaS tools, Slack's directory is a real productivity advantage. For a team that lives in Microsoft 365, Teams' native integrations are a productivity advantage in the other direction. The question is which ecosystem your team already runs on.
Security and compliance
Microsoft Teams wins on enterprise compliance. Teams inherits Microsoft 365's full compliance certification surface (HIPAA, FedRAMP High, GDPR, SOC 2, ISO 27001). For regulated industries (healthcare, financial services, government, defense), Teams is often the only viable option among modern chat tools.
Slack covers most of the same certifications on Enterprise+ tier. The implementation is mature and used by many enterprises. For organizations not in regulated industries, the difference rarely matters in practice. For organizations that ARE in regulated industries, Microsoft Teams is the safer pick.
Pricing tiers
Slack uses straightforward per-user tiers. Pro is $7.25 per user per month on annual billing. Business+ is $12.50 per user per month. Enterprise+ is custom (typically $15 or more). All paid tiers include Slack AI as of mid-2025. Pricing details on slack.com/pricing.
Microsoft Teams pricing is fragmented across multiple Microsoft 365 plans. Teams Essentials is the chat-only standalone at $4 per user per month (rising to $4.50 in July 2026). Microsoft 365 Business Basic is $6 (rising to $7) and includes Teams plus web/mobile Office. Business Standard at $12.50 (rising to $14.50) includes desktop Office. Business Premium is $22 with advanced security. Enterprise plans add another layer. Copilot is a separate $18 to $21 per user per month add-on. Pricing details on microsoft.com.
Both vendors have raised prices in 2026. Microsoft 365 plans get an across-the-board increase in July 2026. Slack tier prices have been stable but the killing of Slack AI as a $10 add-on raised the effective price for teams that did not previously buy AI. The math depends on team size and what you actually use.
The Microsoft Teams unbundling and what it means in 2026
This part has not landed in most ranking comparison articles yet. In November 2025, Microsoft began unbundling Teams from Microsoft 365 globally, after first doing so in the EU and EEA in 2024 to settle European Commission antitrust concerns. The rollout went global through late 2025 and early 2026.
The practical change: Teams is no longer free with Office. New customers buying Microsoft 365 Business Basic, Business Standard, or Business Premium can choose between plans that include Teams and plans that exclude Teams. The unbundled SKUs are priced lower, with Teams sold separately as a $5.25 per user per month add-on for new customers. Existing customers on bundled plans keep their current pricing on renewal, but new SKUs are unbundled.
This matters for two reasons. First, the long-standing argument that "Teams is free if you already pay for Office" is no longer true for new buyers. The economic gravity that pulled most M365 customers into Teams by default has weakened. Second, the unbundling makes the Slack vs Microsoft Teams cost comparison cleaner. You can now run Microsoft 365 without Teams and adopt a different chat tool, paying only the lower no-Teams M365 price plus your chat tool of choice.
For a 25-person team that previously got Teams "free" with M365 Business Standard, the math now shifts. If you renew or sign up new on the unbundled SKU, you pay the lower M365 rate plus a chat tool. Slack at $7.25 per user becomes a real direct comparison rather than an additional spend. So does any other chat-first option, including async-first workspaces.
The freshness of this development is itself an advantage when evaluating older comparison content. Many top-ranking articles still cite "Teams is free with Office" as a Teams advantage. In 2026, that advantage is fading.
Real cost at 10, 25, and 50 seats
Most comparison articles model 10 seats and stop. Below is the verified annual cost at 10, 25, and 50 seats using 2026 list prices on annual billing. Microsoft Teams pricing assumes Teams plus the relevant M365 plan since most buyers do not run Teams Essentials standalone past the smallest sizes. Rock is included as a flat-rate reference for the chat-tool category.
Team size
Slack Pro (incl. AI)
Slack Business+ (incl. AI)
Teams Essentials
M365 Business Standard
M365 Bus. Std + Copilot
Rock Unlimited
10 people
$870
$1,500
$480
$1,500
$3,720
$899
25 people
$2,175
$3,750
$1,200
$3,750
$9,300
$899
50 people
$4,350
$7,500
$2,400
$7,500
$18,600
$899
Three things stand out. First, Slack Pro at $7.25 per user (with AI bundled) is the cheapest option once you get past the smallest team sizes. Second, Microsoft 365 Business Standard plus Copilot is the most expensive paid path, more than 4× Slack Pro and more than 20× Rock at 50 seats. Third, Rock at $899 per year on annual billing is cheaper than every paid Slack or Microsoft Teams option once you cross about 10 to 12 people.
The breakeven math: at 10 people, Slack Pro ($870) and Rock ($899) cost roughly the same. Past 12 people on Slack Pro, Rock starts to cost less. At 25 people, Rock at $899 is a quarter of Slack Pro's $2,175 or a tenth of M365 Business Standard plus Copilot at $9,300. At 50 people, the gap is dramatic enough to fund a part-time role with the savings.
None of this matters if Slack or Microsoft Teams is the right tool for the work. Pricing alone is a bad reason to switch. But the math becomes part of the conversation as teams grow past 15 people, especially when AI add-on costs stack on top of base licensing. For broader cost-modeling against the wider category, see our task management apps roundup.
Or skip the choice entirely
Rock combines chat, tasks, and notes. Built for client work, free for small teams.
Slack is the right pick for teams that lead with chat and want the deepest integration ecosystem. Some specific cases.
SaaS-first companies and startups. If your stack is built on tools like Salesforce, HubSpot, GitHub, Jira, Linear, Figma, or Notion, Slack's integration directory delivers the deepest connections in the category. Most modern SaaS tools have a Slack integration before they have a Teams one.
Teams already in the Salesforce orbit. Slack plus Salesforce gives you Agentforce agents inside chat, channel access to CRM records, and unified search across both. For sales-heavy organizations, the integration is meaningful.
Teams that want bundled AI without paying extra. Slack AI is included in all paid tiers as of mid-2025. Compared to Microsoft Copilot's $18 to $21 per user per month surcharge, Slack's bundled approach is dramatically cheaper for teams that want chat-first AI.
Teams that prioritize threading and channel discipline. Slack's threading model is the most mature in the category. Teams that depend on async work and channel-based information architecture will feel at home faster.
Skip Slack if. You already pay for Microsoft 365 and your team mostly uses Outlook, Word, and Excel. You need enterprise-grade compliance for regulated industries. You run heavy meeting volume and want video as a first-class feature. Or your team is on a tight budget and the per-user math at scale is a problem.
When to pick Microsoft Teams
Microsoft Teams is the right pick for teams already standardized on Microsoft 365 or working in regulated industries. Some specific cases.
Teams already on Microsoft 365. If your team uses Outlook for email, Word for documents, Excel for spreadsheets, and SharePoint for file storage, Teams sits in the middle of the workflow with zero adoption friction. The integration is unmatched and the learning curve close to zero.
Regulated industries. Healthcare, financial services, government, and defense organizations often have compliance requirements (HIPAA, FedRAMP, FINRA, GDPR) that Microsoft Teams meets out of the box on Enterprise plans. Slack covers similar certifications but the procurement process is often easier with Microsoft.
Teams that need video as a first-class feature. Teams' meeting platform is more mature than Slack's. Recording, transcription, breakout rooms, AI-generated highlight reels, and webinar tooling come built in. For organizations running frequent formal meetings, Teams reduces the need for a separate video tool.
Teams that want Copilot integrated across the workspace. Microsoft Copilot grounded across Outlook, Word, Excel, SharePoint, OneDrive, and Teams is more capable than Slack AI for cross-tool workflows. The cost is real, but for teams where Copilot replaces multiple AI tools, the math can work.
Skip Microsoft Teams if. Your team does not use Microsoft 365. You are SaaS-first and want the deepest third-party integration directory. You want bundled AI without a separate Copilot license. Your team is small enough that the M365 ecosystem benefits do not pay back the lock-in. Or you want to avoid platform dependency on Microsoft.
When you should pick neither
The Slack vs Microsoft Teams question hides a third question: is chat alone the right tool, or do you actually need chat plus tasks plus notes in one workspace? Slack and Microsoft Teams are both chat-first products. They do not bundle real task management or document collaboration. So most teams using either pair it with a separate project management tool (ClickUp, Asana, Monday, Trello, Notion) and a separate document tool. Three tools, three bills, three places where information lives.
The Harvard Business Review study on app toggling found that knowledge workers switch apps up to 1,200 times per day, losing roughly four hours a week to context switching. Stacking Slack on top of a PM tool on top of a doc tool makes that number worse, not better. For agencies and growing teams that pull clients and freelancers into the work, the per-seat math on guest access compounds the cost.
"We need to be willing to lose familiar territory and gain new ground." - Satya Nadella, CEO of Microsoft
Nadella's line applies to the Microsoft Teams unbundling itself. The familiar territory was "Teams is free with Office, just adopt it." That gravity is fading. Buyers in 2026 have more freedom to evaluate chat tools on their merits, not on what is bundled with their email. That freedom cuts both ways. Slack benefits because the comparison is cleaner. So does any chat-first workspace that bundles tasks and notes alongside chat.
Rock falls into that last category. Every project space includes its own chat, task board, notes, and file storage. Pricing is flat at $89 a month for unlimited users, or $74.92 a month on the annual plan, which works out to $899 per year. For a 25-person team, that is $36 per person per year, less than three months of Slack Pro at the same headcount. Clients and freelancers join spaces directly without per-seat fees, which solves the cross-organization access tax that bites both Slack Connect and Teams Connect users.
"If you can't decide, the answer is no." - Naval Ravikant, Investor and Co-founder of AngelList
Ravikant's heuristic fits the third-option pivot. If you cannot decide between Slack and Microsoft Teams, the answer might genuinely be neither. Both are competent products. Both have real lock-in. Neither bundles the wider workspace.
Rock is not the right tool for everyone. If your team is 100+ people and needs full enterprise compliance, Microsoft Teams is the safer pick. If your team lives in Salesforce and needs Agentforce agents inside chat, Slack is the better fit. If your team has standardized on Microsoft 365 and the integration cost of switching is high, Teams stays the easier path. Rock fits the chat-first growing team that wants tasks and notes in the same workspace, at flat pricing, without the per-seat tax. That is a real subset of teams, but not the universal answer.
For teams that want to test the chat-first workspace model on real work, Rock's free plan covers 3 group spaces with 5 members each. That is enough to run a project end to end. Compare against your current Slack or Microsoft Teams plus PM-tool plus doc-tool monthly cost. The math at 15 or more people is hard to argue with. See our instant messaging apps guide, the Slack vs Google Chat head-to-head, and our communication strategies piece for the wider chat-first context.
FAQ
Is Slack better than Microsoft Teams? Neither is universally better. They are built around different stacks. Slack is the stronger pick for teams outside the Microsoft ecosystem, especially Salesforce-stack and SaaS-first companies. Microsoft Teams is the stronger pick for teams already on Microsoft 365 and for regulated industries that need enterprise compliance. The right choice depends on what your team already runs on.
Is Microsoft Teams free in 2026? No, not the way it used to be. Microsoft began unbundling Teams from Microsoft 365 globally in late 2025. New customers buying Microsoft 365 plans can choose between plans that include Teams and plans that exclude Teams. The free tier of Teams (Teams Free) still exists with limited features. Existing M365 customers on bundled plans keep their current pricing on renewal. But the "Teams is free with Office" line is no longer accurate for new buyers.
Which is cheaper, Slack or Microsoft Teams? It depends on team size and AI needs. At small sizes (under 10 people), Microsoft Teams Essentials at $4 per user per month is the cheapest paid option. Slack Pro at $7.25 per user is more expensive but includes Slack AI bundled. At larger sizes with AI, the math flips. Slack Pro includes AI in the base price. Microsoft Teams Copilot is a $18 to $21 per user per month add-on on top of M365. The cost-modeling table above breaks down each scenario at multiple team sizes.
Does Slack have AI? Yes. Slack AI was a $10 per user per month add-on through 2024. In mid-2025, Slack killed the add-on and bundled the features into every paid tier. So Pro, Business+, and Enterprise+ all include AI summaries, channel recap, search-grounded answers, and Canvas AI editing as part of the base price. Agentforce agents (Salesforce-integrated) are available for compatible setups.
Does Microsoft Teams have AI? Yes, through Microsoft Copilot, which is a separate add-on at $18 to $21 per user per month on top of whichever Microsoft 365 plan you have. Copilot in Teams covers chat summarization, meeting recap with narrated highlight reels, smart scheduling, and grounded answers across Microsoft 365. It is more capable than Slack AI in scope but meaningfully more expensive on a per-user basis.
Can Slack and Microsoft Teams talk to each other? Not natively. There are third-party bridge tools (Mio, Cloudfuze) that synchronize messages between the two platforms, but the experience is imperfect. Most organizations that need both end up running them in parallel for different use cases (Teams for internal Microsoft-stack work, Slack for client channels and SaaS integrations).
What about teams of 5 to 15 people that do not need much? Both Slack and Microsoft Teams have free tiers that work fine for small teams that mostly need basic chat. Slack Free caps at 90 days of message history but covers DMs, channels, basic integrations, and one-on-one huddles. Teams Free covers chat, channels, and limited meetings. For a 5 to 15 person team without complex integration or compliance needs, either free tier is enough, and paid upgrades are not strictly necessary until growth pushes the limits.
Want one workspace where chat, tasks, and notes live together? Rock combines all three with flat pricing for unlimited users. Get started for free.
Most marketing dashboards track 15 to 25 KPIs across acquisition, engagement, conversion, retention, and brand. The honest answer is that a small or mid-sized marketing team only needs about seven, and the relationships between those seven matter more than any single number on its own. Tracking 25 metrics in isolation gives the team noise, not direction. For organic-traffic KPIs specifically, an SEO marketing plan is where they get owned and reviewed. The cleanest filter for what to keep is whether the KPI ladders up to a goal in the marketing plan; metrics without that link tend to be vanity. Stage-specific KPIs sit inside the marketing funnel diagnostic. Channel-specific KPIs sit inside their own plans (the content marketing plan, social media marketing plan, and so on).
This guide covers the seven marketing KPIs that actually move revenue, the benchmarks to compare your numbers against, and how to spot a vanity metric pretending to be a KPI. The Health Check widget further down lets you plug your numbers in and auto-calculates the LTV:CAC ratio that tells you whether the marketing engine is healthy or burning cash.
Marketing KPIs are the small set of metrics that connect marketing activity to business outcomes (revenue, retention, growth). The seven that matter for most teams are CAC, LTV, the LTV:CAC ratio, conversion rate, ROAS, MQL-to-customer rate, and organic-to-MQL rate. Each has a healthy band; the LTV:CAC ratio is the headline number that tells you whether the marketing engine is sustainable.
"Half the money I spend on advertising is wasted; the trouble is I don't know which half." - John Wanamaker
Wanamaker's century-old line is still the cleanest framing of why marketing measurement is hard. The seven KPIs below are the modern answer to his question. Together they tell you which half is working. And they shift the conversation from "are we busy?" to "are we growing?"
The 7 Marketing KPIs That Actually Move Revenue
Each of the seven below has a specific job. Together they cover the full marketing engine. Acquisition cost (CAC) and customer value (LTV) at the top. The ratio that combines them as the headline. Funnel-stage indicators that show where the gap lives. And channel-level efficiency numbers that direct spend.
CAC (Customer Acquisition Cost). Total acquisition spend divided by new customers won in that period. The number to watch alone is interesting; the number relative to LTV is what actually drives the spend decision. Track it weekly for paid channels, monthly for blended.
LTV (Customer Lifetime Value). Average revenue per customer across their full lifecycle. For SaaS, this is monthly subscription times average customer lifespan minus support cost; for agencies, it is average annual retainer times average tenure. LTV is the upstream input to the ratio that matters.
LTV:CAC ratio. The headline number. Below 1:1, the team is destroying value with every customer; 3:1 to 5:1 is the healthy band most growth-stage businesses run on; above 5:1 usually means underspending on acquisition. The ratio is what tells you whether to scale acquisition or fix retention first.
Conversion rate. Visitors or signups who take the target action (paid signup, demo booking, qualified lead). For SaaS trial-to-paid, the healthy band is 8 to 15%. For e-commerce checkout, 2 to 4% is typical. The benchmark depends on the conversion event; what matters is consistent measurement against your own historical baseline.
ROAS (Return on Ad Spend). Revenue attributed to ads divided by ad spend, expressed as a multiple. Healthy is above 3.0x; above 5.0x is great. ROAS is the channel-level efficiency measure that tells you which paid channels deserve more budget and which to cut.
MQL-to-customer rate. The percentage of marketing-qualified leads that convert to paying customers. For B2B, the healthy band is 10 to 20%. Below 5% means either MQL definition is too loose (lead quality problem) or the handoff to sales is broken (process problem). Both are fixable; the metric just tells you which one to investigate.
Organic-to-MQL rate. The percentage of organic-search visitors who convert to MQLs. Healthy is 2 to 5%. This number isolates the SEO-and-content engine from paid; if total MQLs are healthy but organic-to-MQL is weak, you are over-reliant on paid acquisition (which usually means CAC is too high).
"The only way to measure campaigns effectively is against the metrics you want to change and the time you need to do it in." - Mark Ritson, Marketing Week
Ritson's point applies cleanly to this list. Each KPI has a different time horizon: ROAS moves week to week with campaign tweaks, conversion rate shifts month to month with funnel changes, LTV takes quarters to confirm. Setting the same review cadence for all seven is one of the most common mistakes; weekly for fast-moving channel metrics, monthly for funnel rates, quarterly for the ratios that lag.
Benchmarks at a Glance
The table below shows healthy, watch, and fix bands for the five KPIs that have meaningful absolute benchmarks. CAC and LTV are deliberately omitted: they do not have universal bands in isolation (a healthy CAC depends entirely on LTV and vice versa). Their relationship is captured by the LTV:CAC ratio row, which is the single number that matters.
KPI
What it measures
Healthy
Watch
Fix
LTV:CAC ratio
The headline number; combines acquisition cost (CAC) and lifetime value (LTV) into one signal
3:1 to 5:1
1:1 to 3:1, or above 5:1
Below 1:1
Conversion rate
Visitors or signups who take the target action (paid signup, lead, demo)
SaaS trial-to-paid 8% to 15%
4% to 8%
Below 4%
ROAS
Revenue attributed to ad spend divided by ad spend
Above 3.0x
2.0x to 3.0x
Below 2.0x
MQL-to-customer rate
Marketing-qualified leads that close to paid customers
10% to 20% B2B
5% to 10%
Below 5%
Organic-to-MQL rate
Organic-search visitors who convert to MQLs
2% to 5%
1% to 2%
Below 1%
Two cautions on the bands. First, the LTV:CAC ratio assumes a roughly 12-month payback window; subscription businesses with longer contracts can sustain a lower ratio because acquisition cost is recovered over more years. Second, conversion rate benchmarks vary widely by channel and audience; a 4% trial-to-paid conversion is normal for cold paid traffic and underwhelming for warm referral traffic. Compare against your own baseline more than against industry averages.
Marketing KPI Health Check
Type your numbers and see where each one sits against industry bands. The auto-calculated LTV:CAC ratio is the headline number that tells you whether the marketing engine is healthy.
Customer acquisition cost
Healthy depends on LTV (see ratio below)
$
Type
Customer lifetime value
Higher is better; pair with CAC
$
Type
Conversion rate (signup to paid)
Healthy band: 8% to 15% for SaaS
%
Type
Return on ad spend
Healthy: above 3.0x; great: above 5.0x
x
Type
MQL-to-customer rate
Healthy band: 10% to 20% for B2B
%
Type
LTV:CAC ratio (the headline number)-
Type CAC and LTV to see your ratio. Healthy is 3:1 or better.
0 of 5 healthy
Three or more in the green means the engine is working. Track these alongside the campaigns that move them.Try Rock for free
The widget above is the version we hand to teams when they want to see how their numbers stack up. The auto-calculated LTV:CAC ratio is the headline output; everything else feeds into it. Plug in your last 90 days of data and the bands tell you which input to fix first.
The hierarchy in the widget is deliberate. CAC and LTV roll up to the LTV:CAC ratio because that ratio is the only number that combines acquisition and retention into one signal. Conversion rate, ROAS, and MQL-to-customer rate are the funnel-level inputs that show where the ratio gap is forming. The team uses the ratio to decide whether to scale or fix; the funnel metrics tell them where to focus.
Vanity Metrics Marketing Teams Confuse for KPIs
Three numbers show up on most marketing dashboards and do not belong as headline KPIs. Impressions and reach measure that the campaign exists, not that it works; the honest replacement is traffic that converts. Followers and likes reward a content strategy that may have nothing to do with the buyer; the honest replacement is engaged followers who clicked through and converted. Email open rates have been broken since iOS 15's privacy update; the honest replacement is click-through to a revenue-driving page.
The full pattern (and the way to clean up a marketing dashboard that has drifted into vanity) sits in our vanity metrics deep dive. The shortcut here is the same: if a number can move 50% next quarter without revenue or retention being measurably better, it is vanity, not a KPI.
How to Choose Your 7 Marketing KPIs
The mechanics of choosing are straightforward; the discipline is in keeping the list at seven. Five steps separate a focused dashboard from a 25-tile wall of numbers.
Start with the revenue equationMarketing exists to grow revenue. Write the equation: customers = visitors x conversion rate. Revenue = customers x LTV. Cost of acquiring those customers = CAC. Every KPI on the dashboard should be one of those numbers or a clear input into one of them. Anything that is not measures activity, not impact.
Pick the headline ratio (LTV:CAC)The single most important number for any marketing engine is LTV:CAC. Below 1:1 the team is destroying value with every customer; 3:1 to 5:1 is the healthy band most growth-stage businesses run on. The ratio is what tells you whether to scale acquisition spend or fix retention first.
Add the funnel-stage indicatorsThree numbers tell you where the funnel is leaking: conversion rate (signup to paid), MQL-to-customer rate (lead to revenue), and ROAS (paid efficiency). Each isolates a different stage; together they show whether the gap between LTV and CAC is upstream (acquisition) or downstream (conversion).
Set bands, not just targetsEach KPI needs a healthy band, a watch range, and a fix threshold. CAC under 33% of LTV is healthy; above 50% needs urgent attention. ROAS above 3.0x is healthy; below 2.0x means the channel is leaking. Without bands, the dashboard is decoration.
Cap the dashboard at sevenFive to seven KPIs is the upper limit before the dashboard becomes wallpaper. The recommended seven for most marketing teams: CAC, LTV, LTV:CAC ratio, conversion rate, ROAS, MQL-to-customer rate, organic-to-MQL rate. Skip anything else from the headline view; track it as a context metric if needed.
"If you don't get a recommendation for action, you are using the wrong metric." - Avinash Kaushik, Web Analytics 2.0
Kaushik's test is the cleanest filter for any candidate KPI. Look at each number on your current dashboard; ask "so what?" three times. If the third "so what?" does not produce a clear next step, the metric is decoration, not direction. The seven above pass that test consistently for most marketing teams; channel-specific metrics (impressions, opens, follows) usually do not.
Common Mistakes
The patterns below show up across teams that intend to track marketing KPIs well and quietly drift back to vanity or noise. Most are operational and political, not analytical.
Optimizing CAC in isolationA team that drives CAC down by chasing only cheap channels usually crashes LTV at the same time. Cheap channels often bring in low-intent customers who churn fast. The number to optimize is the LTV:CAC ratio, not CAC alone; a higher CAC with a much higher LTV is the better trade.
Treating ROAS as the ultimate metricROAS measures one transaction's revenue against one campaign's spend. It does not capture lifetime value, repeat purchases, or customer quality. Brands obsessed with ROAS often sacrifice long-term growth for short-term wins; pair it with LTV:CAC before scaling any channel.
Reporting impressions and reach as KPIsImpressions, reach, follower counts, and "share of voice" are vanity metrics in most contexts. They show that the campaign exists; they rarely tell you whether it is working. The honest replacements live one or two steps down the funnel: traffic that converts, leads that close, customers who stick.
Ignoring attribution windowsLast-click attribution makes paid look better than it is and SEO look worse. The first-touch view does the opposite. Most healthy marketing dashboards use multi-touch attribution and report a 14 or 30-day window; without that, the numbers look definitive while quietly mis-allocating budget.
No owner per KPIWhen CAC is "the marketing team's responsibility" or LTV is "the customer success team's number," nobody fixes the trend on the day it slips. Each KPI needs a single named owner whose quarter rides on the metric, not a department.
Setting it once and never recalibratingMarketing channels and conversion benchmarks shift constantly. A KPI set last year may not be the right set this year, and the bands certainly are not. Run a full recalibration once a quarter; drop any KPI the team has not acted on, and update bands to current channel costs.
The biggest of these is the ROAS-as-headline trap. ROAS measures one transaction's revenue against one campaign's spend; it tells you nothing about whether the customer sticks. The LTV:CAC ratio is the upgrade. Run ROAS at the channel level, run LTV:CAC as the headline.
What We Recommend
At Rock we run marketing teams on a pinned KPI note inside the same workspace where campaigns are planned and shipped, with the work tracked in Tasks alongside. The seven KPIs sit at the top with their bands and current values; below that, each KPI links to the campaigns and tasks that move it. Owners post one-line updates on Mondays for any KPI outside its band, and the quarterly recalibration retires anything the team has not acted on.
The reason for keeping the dashboard inside the workspace where the work happens is the same failure mode that hits agency and product teams. Dashboards built in separate BI tools become wallpaper because no one opens them between board meetings. KPI notes pinned next to the team's daily chat and tasks stay visible, get debated, and actually drive action.
Pair this with the broader measurement stack and the seven KPIs become the connective tissue between strategy and execution. The KPI framework covers the discipline of what counts as a KPI. The agency KPIs and sales KPIs pieces are the sister spokes (sales velocity is the sales-side composite that mirrors LTV:CAC here). The billable hours guide covers the operational input layer. The OKR vs KPI bridge and OKR framework cover when to drive change vs hold a standard. Above the dashboard layer, SWOT, Strategic Choice Cascade, and PESTEL set the strategic direction the dashboard tracks against.
Track the seven alongside the campaigns that move them. Rock combines chat, tasks, and notes in one workspace. One flat price, unlimited users. Get started for free.
An organizational strategy is the chosen path a company takes to win in its market: which customers it serves, how it competes, and what it deliberately chooses not to do. Without one, teams default to whatever request showed up most recently, and the company spends a lot of energy moving in slightly different directions every quarter.
This guide covers the definition, the three levels of strategy, the five main types with real-company examples, and a five-step process to build yours. The quiz below maps your default tendencies to the strategy type that fits, so the rest of the article makes sense in your context.
Which strategy fits your org? · 5 questions~60 seconds
An organizational strategy only works if it is the same one across the leadership team and visible to everyone executing it.
What is organizational strategy?
Organizational strategy is the long-term plan that defines where a company plays, how it wins, and what trade-offs it accepts to get there. It answers four questions in a way that constrains daily decisions: who is the customer, what is the offer, how do we compete, and what do we say no to. Everything else (org structure, hiring, product, pricing) is downstream of those four answers.
The phrase often gets confused with "strategic plan" or "business plan." A plan is a list of activities. A strategy is a set of choices. The choices come first; the plan executes them. A company that has a 47-page plan but never picked a strategic stance is operating without a strategy.
"Strategy is about making choices, trade-offs; it's about deliberately choosing to be different." - Michael Porter, Harvard Business School Professor
Good strategies share a few traits. They are clear enough to fit on one page. They are specific enough that two reasonable executives could disagree about which option is correct. And they say no to attractive opportunities that fall outside the chosen stance. A "strategy" everyone in the room agrees with on the first read is usually too generic to constrain anything.
The 3 levels of strategy
Organizational strategy operates at three levels. The same company has all three at once, and they have to line up for the strategy to work in practice.
Corporate level. The whole-company question: which businesses are we in, which markets do we serve, and how do we allocate capital across the portfolio. For a single-product company this is also the business strategy. For a holding company with multiple lines, it is the portfolio decision.
Business level. For each business unit, how do we compete in our chosen market: cost leader, differentiated, focused on a niche, or growing fast. This is where Porter's generic strategies and the five types we cover below live.
Functional level. Each department's plan to deliver on the business strategy: marketing, finance, engineering, sales, operations. Functional strategy is correct when the choices reinforce the business strategy. A premium-priced differentiated company should not have a sales team running a discount playbook.
Most strategy mistakes happen when the levels disagree. The CEO talks about premium positioning and the sales team is rewarded on volume. The board signs a growth strategy and operations gets cut to fund a different priority. Aligning the three levels is half the work of strategy.
Strategy is a small set of choices. The trade-offs you put on the wall are more honest than the slogans that come later.
The 5 main types compared
Most organizational strategies map to one of five archetypes. None is universally better. The right choice depends on the market, the company's capabilities, and the competitive position. The table below summarizes the five with a real-company example for each. We unpack the choice logic in the next section.
Strategy
What it is
Real example
Best for
Skip if
Cost leadership
Compete by being the lowest-cost producer in the category
Walmart, IKEA, Ryanair, Costco
Mature, standardized markets where buyers shop on price
Premium or innovation-driven categories
Differentiation
Compete on something unique that buyers will pay a premium for
Apple, Tesla, Patagonia
Categories where design, brand, or capability matters more than price
Markets with low switching cost and a hard-to-distinguish product
Focus (or niche)
Compete by being the best in the world at one thing for one segment
Linear (devs), Basecamp (small teams), Patagonia (serious outdoor)
Sub-segments that bigger players ignore or serve poorly
Segments large enough that a generalist can absorb them
Growth / expansion
Compete by getting bigger faster than the field, scale becomes the moat
Amazon, early Uber, most B2B SaaS in expansion mode
Markets with weak incumbents or strong network effects
Mature, slow-moving markets where scale just adds cost
Rationalization
Compete by cutting product lines, geographies, and complexity to refocus
Post-merger consolidations, Apple after Jobs returned, GE under Welch
Companies with too many products or too many layers from past expansion
Early-stage companies that have not yet proven a single line
Two notes on the list. First, focus and differentiation often blur together because focused players differentiate within their niche. The distinction is the size of the addressable market, not the type of advantage. Second, growth and rationalization can sit on top of any of the other three. A cost-leader can be in growth mode (Walmart in the 1990s) or in rationalization mode (Walmart simplifying its US store count in the 2010s).
"Strategy is the answer to two basic questions: where will you play, and how will you win?" - Roger Martin, co-author of Playing to Win
Want this framework as a workspace?
Rock ships ready-to-use templates for SWOT, Eisenhower, sprints, and more.
Strategy is rarely built from a blank page. Most teams refresh an existing position rather than invent one. Either way, these five steps produce a one-page strategy that the team can actually execute.
Step 1: Set the vision and mission. Vision is the long-term picture of what the world looks like if you succeed (10 to 20 years out). Mission is what the company does today to get closer to that vision. Both should fit in a sentence. If the mission could apply to three of your competitors, it is too generic.
Step 2: Diagnose the situation. A strategy is built on a clear-eyed view of where you are. Run a SWOT analysis to surface internal strengths and weaknesses against external opportunities and threats. Layer in Porter's Five Forces to map the competitive structure of your market. McKinsey's primer on competitor analysis covers the parts most teams skip when running this. The output is one page that names the two or three strategic challenges you actually have to address.
Step 3: Assess capabilities honestly. Strategies fail at execution. The bridge between strategy and execution is whether you have the capabilities to pull it off. Use the VRIO framework (valuable, rare, inimitable, organized) to test whether your competitive advantages are real or aspirational. The original framing comes from Prahalad and Hamel's "Core Competence of the Corporation" in HBR, which is still the cleanest definition. If two of three needed capabilities are weak, the strategy is a wish, not a plan.
The hard part of strategy is not the choice itself. It is getting every leader rowing in the same direction afterwards.
Step 4: Pick a primary stance. Choose one of the five strategy types and commit to it for the next 12 to 18 months. The hard part is what you say no to. A differentiated stance means walking away from price-sensitive customers. A cost-leader stance means walking away from custom features that hurt margins. Write the no list down. It is the part that actually constrains decisions.
Step 5: Set goals, metrics, and a review rhythm. Translate the stance into three to five measurable company goals for the year. Each goal needs an owner, a metric, and a quarterly milestone. Set a monthly check-in to review progress and a quarterly review to update the strategy if reality has shifted. The cadence is what keeps the strategy alive between offsites.
"Culture eats strategy for breakfast." - Peter Drucker, Management Theorist
Drucker's line is a warning, not a dismissal. The strategy can be perfect on paper and still fail because the operating culture rewards different behaviors. The fix is to build cultural signals into the rollout. Make visible decisions in service of the stance, recognize choices that reinforce it, and quietly correct when leaders default to old habits.
Connecting strategy to other frameworks
Organizational strategy sits at the top of a stack of more specific frameworks. Each one feeds into a different step of the build process.
SWOT and TOWS.SWOT diagnoses your starting point. TOWS turns the diagnosis into action by pairing internal and external factors. Use SWOT in step 2 to see clearly, then TOWS to translate clarity into a short list of strategic moves.
Porter's Five Forces.Porter's framework tells you how attractive the market is by mapping five competitive forces. Use it in step 2 to understand whether the structural economics of your market favor cost leadership, differentiation, or focus.
VRIO.VRIO tests whether the resources you plan to use are actually a competitive advantage. Use it in step 3 to filter aspirational capabilities from real ones before locking the stance.
The frameworks are tools, not deliverables. A team that does SWOT, Porter's, and VRIO and never picks a stance has done analysis, not strategy. The point of the analysis is to inform a choice.
The strategy review rhythm matters more than the offsite. A quarterly cadence beats an annual deck.
Common mistakes to avoid
Most organizational strategies fail in the same handful of ways. None is about the framework choice. They are about the discipline of picking a stance, building the capabilities, and running the cadence.
Picking two strategic stances at the same timeCost leadership and differentiation are choices that demand different operating models. Trying to be the cheapest and the most premium at once usually produces neither. Pick one primary stance for the next 12 to 18 months and treat the others as guardrails, not co-equals.
Copying a competitor's strategy without their advantagesWalmart can run cost leadership because of decades of supply chain investment. Apple can run differentiation because of decades of brand and design capability. Adopting the strategy without the underlying capabilities just means losing the same fight slower. Run a VRIO check before committing to a stance.
No honest capability assessmentStrategies fail at execution, not at the whiteboard. Before locking the stance, list the three capabilities you would need to execute it and rate yourselves honestly. If two of three are weak, the strategy is aspirational, not operational. Build the capabilities first or pick a different stance.
Vision without an execution rhythmA strategy doc nobody references after the offsite is not a strategy, it is a document. Tie the strategy to a quarterly cadence: a small set of measurable goals, a monthly review, and visible decisions made in service of the stance. The cadence is what keeps the strategy alive.
Treating strategy as annual instead of continuousMarkets shift, competitors move, and the right stance in March may be wrong by September. The annual offsite is a useful checkpoint, not the whole process. Build a quarterly review into the operating rhythm so the stance is updated when reality changes, not when the calendar says so.
What we do at Rock for strategy work: we run the SWOT, VRIO, and stance-pick steps in shared spaces with the leadership team. The document stays open for the quarter so the strategy is something people reference, not a slide that lives in a deck. Execution (goals, owners, monthly reviews) lives in the same workspace as the chat surfacing issues. The strategy stays connected to the daily work that delivers it.
An organizational strategy is only as useful as the operating rhythm behind it. Rock combines chat, tasks, and notes in one workspace so strategy stays connected to the work that delivers it. One flat price, unlimited users. Get started for free.
Billable hours are the foundation of how most service businesses bill clients, and almost the only number some firms track on the way to profitability. They are also misunderstood. Most teams confuse billable hours with hours worked, with utilization, and with productivity. Each of those is a different number, and each tells you something different about the business. Getting the four of them straight is what separates a firm that knows its numbers from a firm that just keeps a timesheet. The number is also the financial output of healthy marketing operations; weak ops shows up as low billable utilization long before the P&L does. Resource allocation is the lever that fixes utilization gaps before they reach the timesheet. A solid marketing plan sets the goals these hours need to deliver against; without it, the timesheet is just bookkeeping.
This guide covers what billable hours actually are and how to calculate and chart them in the standard six-minute increments. It includes realistic annual targets for law firms and agencies, plus how to connect billable hours to the KPIs that matter (utilization, margin, retention). The calculator further down lets you plug your numbers in and see what they imply.
Billable hours are the time a service provider spends working directly on a client matter that can be charged to that client at an agreed rate. Research, drafting, calls, meetings tied to a specific client engagement, and revisions are billable; internal meetings, hiring, training, and business development are not. Most firms track billable hours in 0.1-hour (six-minute) increments and bill at an hourly rate set in the engagement letter or statement of work.
The term originated in legal practice and is canonical in law firms, but agencies, consultancies, accounting firms, and other professional services use the same model. The mechanics are identical; only the language and the typical targets differ.
"Until we can manage time, we can manage nothing else." - Peter Drucker, The Effective Executive (1967)
How to Calculate Billable Hours
The calculation is straightforward: total time spent on a billable task, converted to a decimal, multiplied by the hourly rate. The convention is to round to the nearest tenth of an hour (six minutes), so a 22-minute call lands at 0.4 hours and bills at 0.4 times the rate. A $150-per-hour rate on a 0.4-hour entry produces a $60 charge.
Real precision matters more than it looks. A firm that consistently rounds down (or "forgets" to bill the last call of the day) leaks 10 to 20% of revenue per attorney or consultant per year. The opposite is also a problem: aggressive rounding up creates client-trust damage and audit risk. Track in real time, in 0.1 increments, and let the math do its job.
Billable Hours Chart
The chart below maps minute ranges to the standard 0.1-hour decimal increments and shows the billed amount at a $150 rate. Print it, pin it next to the timesheet, or build the conversion into your time-tracking tool.
Time worked
Decimal increment
Billed amount at $150/hr
1 to 6 min
0.1
$15.00
7 to 12 min
0.2
$30.00
13 to 18 min
0.3
$45.00
19 to 24 min
0.4
$60.00
25 to 30 min
0.5
$75.00
31 to 36 min
0.6
$90.00
37 to 42 min
0.7
$105.00
43 to 48 min
0.8
$120.00
49 to 54 min
0.9
$135.00
55 to 60 min
1.0
$150.00
Two practical notes. First, the "round to the nearest 0.1" convention is the most common; some firms use 0.25-hour (15-minute) blocks for simpler accounting, at the cost of less precision. Second, the IRS and most state bars expect contemporaneous time records. The chart works as a calculation aid, not as a substitute for actually tracking each entry as it happens.
Billable Hours Calculator
Plug in your numbers and see what they actually imply: annual billable hours, revenue, and the utilization rate that matters more than either.
hrs
$
days
hrs
Annual billable hours
1,100
hrs/year
Annual billable revenue
$165,000
at $150/hr
Utilization rate
62.5%
of available time
Where you sitType
Type your numbers to see where utilization lands.
Healthy band: 65 to 80% utilization
Track this alongside the work. Utilization is one of the five KPIs that actually run a service business.Try Rock for free
The calculator above is the version we hand to teams considering whether their target is realistic. Plug in billable hours per day, hourly rate, working days, and total available hours. The output is annual billable hours, billable revenue, and the utilization rate that turns the raw hour count into a meaningful number. Once the target is set, Rock's Time Tracker captures the actual entries in real time so you can compare planned hours against what gets logged.
Annual Billable Hours: What's Realistic?
Annual targets vary widely by industry and firm size. Law firms set associate billable-hour targets between 1,700 and 2,300 hours per year, with 1,800 to 2,000 typical at small and mid-sized firms. Marketing and creative agencies usually expect 1,400 to 1,800 hours per FTE per year. The agency number is lower because more of an agency's value comes from non-billable activities like strategy, internal craft, and business development. Consulting firms often aim higher, with management consultants regularly billing above 1,800 hours.
That 2.9-hour-per-day data point is the most honest number in the legal industry. A 1,800-hour annual billable target divided across 220 working days requires 8.2 billable hours per day. The Clio finding says the typical lawyer hits roughly 35% of that, then stretches the workday to make up the gap. The result is the well-documented pattern where attorneys "working 1,800 billable hours" actually work 2,400 to 2,600 total hours. Mosaic's professional-services utilization benchmarks show the same gap across consulting and creative agencies.
The agency reality is similar but less extreme. A 1,500-hour target divided by 220 days is 6.8 hours per day. Most agencies land at 4 to 5 actual billable hours, with the rest absorbed by team meetings, client management calls, and internal craft. Setting the target without acknowledging this gap creates a culture of silent over-commitment.
Billable vs Non-Billable: What Counts
The line between billable and non-billable is mostly clear at the extremes and fuzzy in the middle. The table below shows the categories most service businesses actually use. The hybrid column is the one worth defining clearly in your engagement letter; ambiguity here costs you the trust the rest of the relationship is built on.
Billable
Non-billable
Hybrid (case by case)
Client meetings, calls, status reviewsResearch and analysis on a specific matterDrafting deliverables (briefs, design files, code)Revisions tied to a specific client requestEmail correspondence about the work
Internal team meetings and stand-upsHiring, onboarding, performance reviewsBusiness development and pitchesContinuing education, training, certificationsTool evaluation, software upgradesPro bono and unbilled discount work
Travel to client site (often billable, sometimes half-rate)Invoicing and admin specific to the clientDrafting the SOW or contract before sign-offQuick "favor" calls outside scopeAccount-management cadence (depends on retainer terms)
The hybrid column also exposes a common scope-creep pattern. "Quick favor" calls outside scope, drafting an SOW for the next phase, and account-management cadence all feel non-billable. They quietly accumulate to 5 to 15% of an account manager's time per quarter. Decide upfront whether they are absorbed into a retainer, billed at a reduced rate, or capped, and write the rule down.
From Billable Hours to Profitability
The whole point of tracking billable hours is to drive profitability, but billable hours alone do not measure that. Three numbers turn raw hour counts into something useful. Utilization rate is billable hours as a share of available hours, healthy at 65 to 80%. Realized rate is revenue per billable hour after writeoffs and discounts. Project gross margin is project revenue minus direct delivery cost. Tracked together, they tell you whether the work is profitable. Tracked alone, billable hours just tells you the team is busy. The OKR vs KPI guide covers how billable hours, KPIs, and OKRs hand off operationally.
"The billable hour is insane because the time something takes has no relation to its value." - Ron Baker, VeraSage Institute
Baker's critique is the contrarian frame that more firms should consider. The billable hour rewards time spent, not outcomes delivered. It penalizes the experienced consultant who solves a problem in two hours instead of twenty. And it ties revenue to capacity instead of value. Value-based pricing is the alternative for firms ready to move beyond the model. For most service businesses, though, billable hours remain the operational unit. The upgrade is in what you do with the data, not whether you collect it. Fixed-fee retainers and value-based engagements still rely on internal hour tracking to know whether the work is profitable; you just stop showing the timesheet to the client.
Connecting hours to the rest of the dashboard is the work. The five agency KPIs we run on (margin, utilization, NRR, NPS, win rate) are the layer above raw hours; this article is the calculation underneath. Tracking hours without those KPIs is data without a decision; tracking the KPIs without hours is opinion without evidence.
Common Mistakes
The patterns below show up across firms that intend to track billable hours well and quietly drift into one of the failure modes. Most are operational, not analytical.
Tracking hours at end of day or end of weekMemory underestimates billable time by 15 to 25%. The Clio Legal Trends Report finds lawyers leave roughly 10 hours of billable time on the table each month from delayed entries. Track in real time or within the same hour, every time.
Treating billable hours as the KPIBillable hours is the input, not the outcome. Hours alone tells you how busy people are; pair it with utilization rate (billable as a share of available) and project gross margin (revenue minus delivery cost) before declaring a healthy month.
Pushing utilization above 85% as the standing targetHigh utilization looks profitable on the quarterly P&L and burns out the team in practice. Above 85% week after week means overtime, sick days, and quality cliffs by quarter end. The healthy band is 65 to 80%; aim there as the baseline, not the ceiling.
Confusing billable hours with hours workedLawyers and consultants who hit a 1,800-hour annual target typically work 2,400 to 2,600 hours when you add the non-billable load. Reporting "billable hours" without acknowledging the non-billable shadow makes targets look easier than they are and leads to silent over-commitment.
Not separating billable, non-billable, and hybridA timesheet that lumps all hours into one column wastes the data. Tag each block as billable, non-billable, or hybrid (travel, invoicing, contract drafting). The mix tells you where the team is leaking margin and which "internal" tasks are actually hidden client work.
Tying compensation directly to billable hoursWhen bonuses ride on hour count, the team optimizes for time spent rather than value delivered. The cleaner pattern: tie compensation to project margin or client outcomes, and treat billable hours as one operational input among several.
The biggest of these, by some margin, is the end-of-week reconstruction. Memory underestimates billable time consistently; teams that track in real time recover 10 to 20% more billable revenue than teams that fill in timesheets on Friday afternoon. The widget at the top will show you the dollar value of that gap on your numbers.
What We Recommend
At Rock we run service-business teams on the same workspace pattern we recommend for the rest of the strategy stack. Rock's built-in Time Tracker sits inside the same workspace as the team's chat, tasks, and notes. Timers start and stop on each task, with billable and non-billable tags applied at the moment of entry. Each project has its own space; each client has a pinned note summary with budget, billed-to-date, and current utilization, plus tracked tasks for the work itself. Weekly reviews check the numbers against the bands; quarterly recalibration adjusts the targets.
The reason for keeping time tracking inside the same workspace as the work is the failure mode otherwise. Tracking apps that live separately from the work create an extra context switch, which is exactly when team members forget to log entries. The closer the timer is to the task, the more accurate the data.
Pair this with the broader measurement stack and billable hours becomes the input layer underneath. The agency KPIs, marketing KPIs, and sales KPIs pieces cover what to track at the dashboard layer for each function. The vanity metrics deep dive covers what to cut. The KPI framework covers the discipline of what counts as a KPI. The OKR framework covers the change side of measurement. Above the dashboard layer, SWOT, Strategic Choice Cascade, and PESTEL set the strategic direction. Together they turn raw hour data into the operating system of a service business.
Track billable hours alongside the work that produces them. Rock combines chat, tasks, notes, and time tracking in one workspace. One flat price, unlimited users. Get started for free.
Monday and Notion both promise one workspace for your team, but they start from opposite ends. Monday starts from the board. Color-coded columns, status fields, automations, and dashboards run the day, and writing happens in card descriptions or on a side panel. Notion starts from the page. Pages, databases, and views give you the components, and you assemble your own project tracker on top.
That single difference shapes the Monday vs Notion choice more than any feature comparison. This guide compares them axis by axis, then runs the real cost at 5, 15, and 30 seats. Some teams should pick Monday. Some should pick Notion. Some should pick neither because the chat-first workspace closer to how they actually communicate lives somewhere else. Run the recommender below for a starting point.
Notion can do tasks, but tasks are a database view inside a page-first workspace. Monday flips that, putting the board first and the doc on the side.
Quick answer. Monday is a visual Work Platform built around the board. Notion is a flexible workspace built around the page. Pick Monday if your team needs visual project execution with deep automations and dashboards. Pick Notion if your team needs a real knowledge base and tasks are a side benefit. Pick neither if you want chat, tasks, and notes in one workspace without paying for a separate messaging tool.
Want chat with your work platform?
Rock pairs messaging with tasks and notes. One flat price, no per-seat scaling.
Monday started in 2014 as a "Work OS." In early 2026 the company rebranded the platform as an "AI Work Platform." The product is the same family of color-coded boards, status columns, automations, and dashboards. The pivot reflects how heavily Monday has invested in AI over the last 18 months.
The 2026 release matters for this comparison. Sidekick, Monday's AI assistant, became account-wide rather than board-only. AI Blocks (sentiment analysis, extraction, summarization, translation) ship bundled on every paid plan with 500 free monthly credits. The AI Notetaker joins Zoom, Meet, and Teams calls and turns conversations into tasks. In February 2026, Monday launched Call My Agent, a multi-step automation block that strings together AI actions across boards. Most ranking comparison articles have not caught up to any of this.
"Vision without execution is hallucination." - Henry Ford, Founder of Ford Motor Company
Ford's line fits Monday's positioning well. The product is built for execution, not planning. Marketing teams running campaigns, operations teams running processes, sales teams running pipelines, and HR teams running recruitment fit the board-and-automations model. Cross-functional dashboards roll up the work for managers without requiring everyone to write status updates.
Where Monday struggles is documentation. Monday Docs exist and handle simple write-ups well. They are not built for nested wikis, knowledge bases, or product specs that need to grow over years. Teams that lead with writing usually pair Monday with another tool. See our Monday alternatives breakdown for the wider field, or our ClickUp vs Monday, Asana vs Monday, and Trello vs Monday head-to-heads for adjacent comparisons.
Monday's board is the universe. Color-coded columns, automations, and dashboards do most of the heavy lifting before anyone needs to write a doc.
What Notion is built for
Notion takes the opposite approach. Every page is a flexible block-based document. Any page can become a database. Tables, kanban boards, calendars, and galleries are all views over the same data. The trade-off is that nothing comes pre-built. You decide what your project tracker looks like, what fields a task has, how docs are organized, and how teammates navigate the workspace.
Product specs, engineering wikis, content calendars, OKR trackers, customer research libraries, and onboarding handbooks live well in Notion. The free plan is generous for individuals and small teams. Notion AI was bundled into the Business plan in May 2025, which means teams paying $20 per user per month get a writing assistant, summarization, action-item extraction, and Q&A across the workspace at no extra cost.
"If you can't explain it simply, you don't understand it well enough." - Albert Einstein, Theoretical Physicist
Einstein's line is the spirit of Notion. The tool exists to take what is in your head and turn it into something the team can read, search, and build on. The trade-off is real. The flexibility that makes Notion powerful also makes it slow to set up and easy to over-engineer. Many teams build elaborate Notion workspaces that nobody but the original architect understands. For the broader field, see our Notion alternatives guide. For different head-to-heads in the same cluster, see Notion vs ClickUp, Notion vs Trello, Asana vs Notion, Basecamp vs Monday, and Basecamp vs Notion.
Monday vs Notion side-by-side
Five axes matter when picking between these tools. Visualization, automation, AI in 2026, docs, and pricing. Here is how each one stacks up.
Feature
Monday
Notion
Built around
The board (visual workflow)
The page (docs and databases)
2026 positioning
AI Work Platform (was Work OS)
Flexible workspace with bundled AI
Best for
Visual project execution, ops, marketing, CRM
Knowledge bases, wikis, docs that do tasks
Views
Kanban, Gantt, Calendar, Timeline, Dashboard, Map
Page, table, board, calendar, gallery, timeline
Docs and wiki
Monday Docs (basic, board-adjacent)
Best in class for nested pages
AI in 2026
Sidekick account-wide, AI Blocks bundled, "Call My Agent" automations
Notion AI bundled in Business plan (May 2025)
Automations
Deep, no-code workflow builder
Database actions, lighter
Free plan
2 seats, 3 boards, 3 docs
Unlimited blocks, 7-day history
Paid from
Basic $9/seat/mo (annual)
Plus $10/seat/mo (annual)
Higher tier
Pro $19/seat/mo (annual)
Business $20/seat/mo (incl. AI)
Mobile
Strong
Functional, slower than desktop
Learning curve
Moderate
Steep
Boards versus pages
This is the spine of the Monday vs Notion comparison. Monday is built around the board. Each board is a self-contained workspace with columns (status, owner, date, dropdown, formula, more), rows (the work itself), and views over both. The board is the universe. Documentation is something that lives next to the board, not above it.
Notion is built around the page. Each page is a flexible canvas that can hold writing, embedded databases, sub-pages, and views. Pages nest into a hierarchy. The workspace is the universe. A board is one of many views over a database that lives inside a page.
For teams that lead with executing visible workflows, Monday's model fits. For teams that lead with writing and structured information, Notion's model fits. Most teams have both kinds of work, which is why a real number end up running both tools.
Automation depth
Monday wins decisively on automation. The no-code automation builder triggers on status changes, due dates, custom field updates, time-based events, and external webhooks. Pre-built recipes cover most common cross-tool flows: Slack notifications on assignment, email when status moves, recurring task creation, board-to-board sync. February 2026 added Call My Agent, which strings multi-step AI actions together inside a single automation block.
Notion automations are lighter. Database actions and a more recent automation builder cover basic flows. Most Notion teams that need cross-tool automation pair Notion with Zapier or Make, which adds another bill and another tool to manage. The gap is real for ops-heavy teams that depend on workflow automation as part of the daily job.
AI in 2026
Both tools have moved aggressively on AI in 2026, but in different directions.
Monday's AI is execution-focused. Sidekick is now an account-wide assistant rather than board-only. The AI Notetaker joins video calls and creates tasks from action items. AI Blocks (sentiment, extract, summarize, translate) ship bundled on every paid plan with a 500 monthly credit allowance. Call My Agent, launched in February 2026, lets you build multi-step AI workflows inside automation blocks. The Vibe feature lets non-developers build custom apps from prompts. Monday's pivot from "Work OS" to "AI Work Platform" reflects this depth.
Notion's AI is doc-focused. Notion AI handles writing assistance, summarization, action-item extraction, Q&A across the workspace, and the Notion Agent feature. Since May 2025, Notion AI is bundled into the Business plan at $20 per user per month rather than a separate add-on.
For teams that will use AI for project execution and operations, Monday's set is broader. For teams that will use AI for writing, research, and knowledge work, Notion's set is more polished. Most older comparison articles still cite Notion AI as a separate $8 add-on, which is no longer accurate. The 2026 reality is that both tools bundle AI into their main paid tiers.
Docs and wiki
Notion wins decisively. The block-based editor, nested page hierarchy, linked databases, and synced blocks make Notion the strongest knowledge tool in the comparison. Teams that build wikis, product specs, and meeting note systems in Notion rarely move away because the doc experience itself is the product.
Monday Docs cover the basics. They handle short docs, board-adjacent notes, and simple write-ups well. They are not the place to build a 500-page wiki or a customer support knowledge base. Teams that want both Monday's execution depth and a real wiki end up running Monday plus Notion or Monday plus Confluence.
Pricing model
Monday uses a per-seat model with several tiers. Basic is $9 per seat per month on annual billing, Standard is $12, Pro is $19, and Enterprise is custom (typically $24-30+). The free plan caps at 2 seats. Pricing details on monday.com/pricing.
Notion also uses per-seat. Plus is $10 per user per month on annual billing. Business is $20 per user per month with Notion AI bundled. Pricing details on notion.com/pricing.
The headline math depends on team size and tier. We model that next.
Real cost at 5, 15, and 30 seats
Most comparison articles model 10 seats and stop. Below is the verified annual cost at 5, 15, 30, and 50 seats using 2026 list prices on annual billing. Rock is included as a flat-rate reference because the math gets interesting at the larger sizes.
Team size
Monday Basic
Monday Standard
Monday Pro
Notion Plus
Notion Business (incl. AI)
Rock Unlimited
5 people
$540
$720
$1,140
$600
$1,200
$899
15 people
$1,620
$2,160
$3,420
$1,800
$3,600
$899
30 people
$3,240
$4,320
$6,840
$3,600
$7,200
$899
50 people
$5,400
$7,200
$11,400
$6,000
$12,000
$899
Three things stand out. First, Monday Basic at 5 seats is the cheapest paid option in the comparison, but it skips automations and Gantt. Second, Monday Pro and Notion Business sit close in price at the same team size (Pro is slightly cheaper), so the choice between them is rarely about cost alone. Third, Rock at $899 per year on annual billing is cheaper than every paid Monday or Notion option once you cross about 8 to 9 people.
The breakeven math: at 5 people, Monday Basic ($540) and Notion Plus ($600) both beat Rock. Past 9 people on Notion Plus or 8 people on Monday Basic, Rock costs less. At 30 people, Monday Pro at $6,840 per year is more than seven times Rock's annual cost. None of this matters if Monday or Notion is the right tool for the work, but at agency scale the cost gap shapes the conversation.
Pricing also assumes annual billing. Monthly pricing for both Monday and Notion adds 20 to 25 percent. For more cost-modeling against the broader category, see our task management apps guide.
When to pick Monday
Monday is the right pick for teams that lead with visible workflows. Some specific cases.
Marketing and creative ops teams. Campaign trackers, asset reviews, content calendars, and launch plans fit boards naturally. Color-coded status, deadlines, and dashboards roll up the work for the team lead without requiring written status updates.
Sales and CRM-style workflows. Pipelines, deal stages, and follow-up automations work well as boards. Monday's CRM template and integrations cover most B2B sales setups without forcing a separate CRM.
Operations teams that need workflow automation. Daily reminders, status changes triggering Slack messages, recurring task creation, and approval workflows fit Monday's automation builder. The 2026 Call My Agent block extends this to multi-step AI actions.
Teams that want native AI for execution. Sidekick account-wide, the AI Notetaker, and AI Blocks bundled across paid plans are deeper than what most competitors ship in 2026. If AI for project execution is part of how your team works, Monday's set is hard to match.
Skip Monday if. Your work is mostly writing and documentation. You need a deep wiki or knowledge base. Or you are a small team that does not need automation and dashboards. The Basic plan is cheap, but if you are not using the visual workflow features, Notion or a simpler tool fits better.
When to pick Notion
Notion is the right pick for teams that lead with writing and want to build a system. Some specific cases.
Doc-heavy product and content teams. Product specs, engineering wikis, editorial calendars, content briefs, and customer research libraries fit Notion's flexibility. The page-and-database model handles these out of the box. See our communication strategies piece for how doc-led teams structure async work.
Knowledge bases that get heavy daily use. Customer support docs, internal HR handbooks, onboarding wikis, and policy libraries earn back the setup time within weeks. Notion's nested pages and linked databases scale across years of growth.
Solo founders and small teams that want one tool. Notion can be a personal CRM, a project tracker, a journal, and a wiki at the same time. Few tools can. Below 10 people the per-seat cost is reasonable.
Teams that want native AI for writing. Notion AI is bundled into the Business plan at no extra cost since May 2025. The writing assistant, summarization, and Q&A across the workspace are meaningfully better than what most PM tools ship for content work.
Skip Notion if. Your work is multi-project execution with deadlines, dependencies, and visual workflows. You need deep automation. Your team will not invest the time to build a system before using it. Or you have outgrown the per-seat pricing model.
Or pick the third option.
Rock combines chat, tasks, and notes in one workspace. Free for small teams.
The Monday vs Notion question often hides a third question: where does communication live while these tools run? Monday has board comments and Updates feeds. Notion has page comments and mentions. Neither replaces the back-and-forth chat that runs most teams' day. Most teams using either pair it with Slack, Microsoft Teams, or WhatsApp groups, which is where the real cost shows up.
The Harvard Business Review study on app toggling found that knowledge workers switch apps up to 1,200 times per day, losing roughly four hours a week to context switching. So the honest read is: Monday or Notion plus Slack is two to three products, two to three bills, and several places where information lives.
For agencies and growing teams that pull clients and freelancers into the work, the per-seat math on guest access bites quickly. Monday charges for guests on Pro and below, and Notion charges for guests on most paid plans. The chat-first option closes that gap. Rock combines messaging, tasks, and notes in one workspace. Every project space includes its own chat, task board, notes, and file storage. Pricing is flat at $89 a month for unlimited users, or $74.92 a month on the annual plan, which works out to $899 per year.
"Focus on being productive instead of busy." - Tim Ferriss, Author of The 4-Hour Workweek
Honest read on where each tool wins. Monday wins for ops-heavy and process-driven teams that need deep automations and dashboards. Notion wins for docs-heavy teams that need a real knowledge base. Rock wins for chat-first teams that need messaging, tasks, and notes in one place at flat pricing. None of the three is universally right, and any article that pretends otherwise is selling you something.
If you want to test the chat-first model on real work, the Rock free plan covers 3 group spaces with 5 members each. That is enough to run a project end to end with the team. Compare against your current Monday or Notion plus Slack monthly cost. The math at 15 or more people is hard to argue with. See our instant messaging apps guide and our Slack alternatives roundup for the broader chat-first context.
FAQ
Is Monday better than Notion? Neither is universally better. They are built for different jobs. Monday is the stronger pick for teams that lead with visible workflows, automation, and dashboards. Notion is the stronger pick for teams that lead with writing and want a real knowledge base. Picking the wrong one costs setup time and team buy-in.
Can Notion replace Monday? For small teams running simple visual workflows, yes. Notion has a Board view that mimics a Monday-style board, and database properties that mimic Monday's columns. The trade-off is automation depth and dashboard visibility. Notion's automations are lighter, and dashboards across multiple databases require manual setup. For ops-heavy teams that depend on automated workflows, Monday is built for the job and Notion is not.
Can you use Monday and Notion together? Yes, and many teams do. The common pattern is Monday for project execution (boards, automations, dashboards) and Notion for documentation (wikis, specs, meeting notes). Native integrations are limited, so most teams use Zapier or Make to push data between them. The trade-off is two bills, two products to learn, and the integration tax of keeping data in sync. For some teams the combination is worth it. For others, picking one tool and accepting its limits is simpler.
Does Monday have AI? Yes, and the AI footprint expanded heavily in 2026. Sidekick became an account-wide AI assistant. AI Blocks (sentiment, extraction, summarization, translation) ship bundled on every paid plan with 500 free monthly credits. The AI Notetaker joins Zoom, Meet, and Teams calls. February 2026 launched Call My Agent, a multi-step AI automation block. Monday's pivot from "Work OS" to "AI Work Platform" reflects how heavily the company has invested in AI features.
Is Monday or Notion cheaper? It depends on the tier and team size. At 5 seats, Monday Basic ($540 per year) is cheaper than Notion Plus ($600). At 15 seats, Monday Standard ($2,160) is roughly equal to Notion Plus ($1,800), and Monday Pro ($3,420) is similar to Notion Business ($3,600). At 30+ seats, both tools climb past $3,500 per year, and Rock at flat $899 per year becomes meaningfully cheaper than either. The cost-modeling table above breaks down each tier at multiple team sizes.
Want one workspace where chat, tasks, and notes live together? Rock combines all three with flat pricing for unlimited users. Get started for free.
Most agency KPI lists run to 25 metrics across five categories and leave a small studio more confused than when they started. The honest answer is that a 5 to 50-person agency only needs five numbers on its headline dashboard. The other 20 are either vanity metrics, lagging confirmation of what you already know, or metrics designed for shops with full FP&A teams.
This guide covers the five KPIs that actually matter for a small or mid-sized agency or freelance practice, the benchmarks David C. Baker and a generation of agency operators have validated, and how to set the dashboard up so it changes behavior rather than decorating a slide deck. The execution discipline that turns capacity into shipped work is resource allocation; KPIs surface where allocation is breaking long before the dashboard does.
The five numbers below tie back to the goals in your broader marketing plan; KPIs without that link drift into vanity over time.
Agency KPIs are the small set of metrics that tell a service business whether it is profitable, efficient, and trusted by its clients. For a 5 to 50-person agency, the five that matter are project gross margin, billable utilization, net revenue retention, client NPS, and new-business win rate. Each has a healthy band, a watch range, and a fix threshold; teams that track all five with named owners tend to outperform those tracking 25 by a wide margin.
The framework descends from agency-finance authorities like David C. Baker, whose Financial Management of a Marketing Firm remains the canonical reference, and operators like Karl Sakas who translate the numbers into day-to-day decisions.
"Net profit should be at least 15% of fees but ideally in the 15-30% range, after paying yourself what you should." - David C. Baker, Financial Management of a Marketing Firm
The 5 KPIs Every Small Agency Should Track
Each of the five below has a specific job. Together they cover profitability, capacity, trust, and growth. Skip any of them and the dashboard goes blind on a different dimension of the business.
Project gross margin (50% to 65% healthy). Project revenue minus direct delivery cost (people, contractors, third-party tools), divided by project revenue. This is the single most important agency number; it tells you whether the work itself is profitable before any overhead. Tracked at the project level, not just the company level.
Billable utilization (65% to 80% healthy). Billable hours divided by total available hours per FTE. Below 55% means too much bench time; above 85% means burnout and a likely quality cliff next quarter. The band is narrow on purpose, and it is the number most small agencies misjudge.
Net revenue retention (above 100% healthy). This year's revenue from a client cohort, divided by last year's. NRR above 100% means existing clients are growing with you faster than churn is taking them away. Below 90% means the new-business engine is propping up a leaky bucket; the cleanup is upstream of any sales motion.
Client NPS (above 50 healthy). "Would you recommend us to a peer?" scored 0 to 10 across the active client base, on the standard NPS scale of -100 to +100. Above 50 is genuinely strong for a service business. NPS leads NRR by a quarter or two; a drop here is your earliest warning of a retention problem.
New-business win rate (50% to 70% healthy). Closed-won proposals divided by total proposals submitted. Below 35% means you are pitching too widely or pricing wrong on most opportunities. Above 80% is a warning, not a brag: it usually means underpricing or only chasing layups.
"It's not the price you charge, it's how people feel about the price they have to pay." - Blair Enns, Pricing Creativity
Enns's frame is the cleanest defense against the win-rate-too-high trap. If you close everything, you are pricing below the value the client perceives. Raising prices and losing some pitches is healthier than winning them all and leaving 30% margin on the table.
Benchmarks at a Glance
The table below is the version we keep pinned in the workspace. Healthy, watch, and fix thresholds for each KPI, drawn from agency-finance benchmarks David C. Baker and others have published over the past two decades.
KPI
What it tracks
Healthy
Watch
Fix
Project gross margin
(Project revenue minus direct delivery cost) divided by project revenue
50% to 65%
40% to 49%
Below 40%
Billable utilization
Billable hours divided by total available hours per FTE
65% to 80%
55% to 64%, or above 85%
Below 55%
Net revenue retention
This year's revenue from same client cohort, divided by last year's
Above 100%
90% to 100%
Below 90%
Client NPS
"Would you recommend us?" scored 0 to 10, NPS scale -100 to +100
Above 50
30 to 49
Below 30
New-business win rate
Closed-won proposals divided by total proposals submitted
50% to 70%
35% to 49%
Below 35%, or above 80%
Two cautions on the bands. First, they assume a generalist 5 to 50-person shop; specialist firms (high-end strategy, regulated industries, dev shops with large enterprise contracts) will run different numbers. Second, the bands shift over the agency's lifecycle: a year-one shop will not hit 60% margin, and a 30-person studio in year nine should not still be running at 38%. Use the bands as starting calibration, then adjust to your stage.
The health check below grades your own numbers against the same bands. Type each value, see where you sit, and find out which one to fix this quarter.
Agency Health Check
Five numbers tell you whether the shop is running well. Type yours, see where you sit against benchmarks, and find out which of the five you should fix this quarter.
Project gross margin
Healthy band: 50% to 65%
%
Type
Billable utilization
Healthy band: 65% to 80%
%
Type
Net revenue retention
Healthy band: above 100%
%
Type
Client NPS
Healthy band: above 50
pts
Type
New-business win rate
Healthy band: 50% to 70%
%
Type
0 of 5 healthy
Three or more in the green means the shop is running well. Track these in the same workspace as the work that moves them.Try Rock for free
Vanity Metrics Agencies Confuse for KPIs
Three numbers show up on most agency dashboards and do not belong. Hours logged measures activity, not profitability; the honest replacement is project gross margin. Total clients rewards quantity over economics; replace with revenue per client and net revenue retention. Total proposals sent is sales activity, not outcome; replace with win rate and average deal size.
The full pattern (and the way to clean up an agency dashboard that has drifted into vanity) sits in our vanity metrics deep dive. The shortcut here: if a number can move 50% next quarter without the business being measurably better, it is vanity.
How to Set Up Your Agency Dashboard
Setting up the dashboard is straightforward; the discipline is in keeping it small. Five steps separate the agencies that get value from KPI tracking from the ones that pile up half-watched dashboards.
Pull last quarter's numbersBefore you debate which KPIs to track, find out where you are. Pull project margin per client, utilization per FTE, retention by cohort, NPS from the last survey, and your win rate on the last 10 proposals. The exercise itself usually surfaces the worst gap.
Pick five KPIs, not 25Cap the headline dashboard at five metrics. The defaults are project gross margin, context switching, and billable utilization, net revenue retention, client NPS, and new-business win rate. Swap one only if your shop has a structural reason (e.g., retainer-only studios may not need win rate).
Set the band, not just the targetEach KPI needs a healthy range and a threshold that triggers attention. Project margin healthy at 50 to 65%, watch at 40 to 49%, fix below 40%. Without the bands, the team watches the trend without knowing when to act.
Assign one owner per KPIMargin owns by Head of Delivery. Utilization owns by Operations or COO. Retention and NPS own by Head of Account Management. Win rate owns by whoever runs new business. One name per KPI, no shared ownership across three people.
Pin the dashboard inside the workflowA KPI board that lives in a separate BI tool gets opened twice a year. Pin the same five metrics inside the workspace where the team actually works, with a weekly Monday review on the agenda. The closer the metric is to the daily task list, the more likely the team will move it.
"Pricing isn't just about numbers, it's an ops play, and one that can define your agency's future." - Karl Sakas, Sakas & Company
Sakas's point applies beyond pricing. Every one of these five KPIs is an ops play that connects to how the agency runs day to day. Margin moves when delivery process tightens. Utilization moves when scheduling discipline improves. NRR moves when account-management cadence holds. The numbers are the visible layer; the operational practices underneath are what actually move them.
When the Numbers Tell You to Cut a Service Line
The hardest call agency leaders make is killing a service that is technically profitable but pulling the average down. The signal is consistent across our experience and Baker's published benchmarks. A service line running below 35% project margin for three quarters in a row, while the rest of the agency averages above 50%, is dragging the firm.
It is hard to cut because the revenue is real and the team likes the work. But maintaining that service line costs the firm in three ways. It consumes capacity that could go to higher-margin work. It sets internal price expectations the rest of the agency cannot afford. And it keeps clients in the wrong segment. Replace it with a productized offer at a higher price point, or refer the work out to a partner who specializes in it.
The five KPIs make this conversation easier because the numbers, not opinions, do the arguing. Margin per service line, tracked monthly, separates services that look good from services that pay. The team can debate strategy once the math is on the table; without it, the loudest voice in the room usually wins.
The five KPIs surface this decision earlier than gut feel ever could. Margin per service line, tracked monthly, makes the conversation an exercise in reading numbers rather than defending pet projects.
Common Mistakes
The patterns below show up across agencies that intend to track KPIs and slowly drift back to vanity or noise. Most of them come from social pressure, not analytical confusion.
Tracking revenue without tracking margin"We had our best year ever" hits different when you find out half the projects ran below 30% margin. Top-line revenue without project-level margin tracking is the most common mistake in small-agency reporting. Always pair the two; never report one without the other.
Letting utilization drift past 85%High utilization looks great on paper and burns the team out in practice. The healthy band is 65 to 80%. Above 85% means people are working overtime, sick days are piling up, and the next quarter's quality drops. High-utilization quarters look profitable today and produce churn (clients and staff) in three months.
Treating hours logged as a KPIHours logged is a vanity metric for an agency. It tells you how busy people are, not whether the work is profitable. The honest replacement is project gross margin, which combines hours with rate and scope. Tracking hours alone makes the team optimize for time spent, not value delivered.
Ignoring net revenue retentionMost small agencies measure new-business wins and forget that retained client revenue is cheaper to grow. NRR above 100% means existing clients spent more this year than last; that is the cleanest sign the agency is delivering and expanding. NRR below 90% means the new-business engine is propping up a leaky bucket.
Win rate above 80% is a warningA win rate north of 80% sounds great. It usually means the agency is underpricing or only chasing easy wins. The healthy band is 50 to 70%; that says you are competing for real work and winning your share. If you close everything you propose, you are leaving margin on the table.
No owner per KPIWhen margin is "everyone's responsibility" or NPS is "the team's job," nobody fixes the trend on the day it slips. Each KPI needs a single named owner whose Q reputation rides on the number. Shared ownership across three people usually means none of them owns it when it matters.
The biggest of these is the high-utilization trap. Burning teams above 85% looks profitable on the quarterly P&L and shows up as churn (staff and clients) two quarters later. The 65 to 80% band exists for a reason; trust the benchmark over the short-term cash temptation.
What We Recommend
At Rock we run agency clients on the same five-KPI dashboard pinned inside the same workspace where the team chats and ships work. Each one ladders up to the agency’s broader marketing operations. Each KPI has a named owner, a band, and a Monday review on the calendar. When a KPI leaves its band, the owner posts a one-line update with the planned action; if the action is large enough, it becomes next quarter's OKR. The whole system fits in one note plus a recurring task.
The reason for keeping the KPIs in the same workspace (pinned notes, tracked tasks) as the work is the failure mode most agencies hit. Dashboards built in separate BI tools become wallpaper because no one opens them between board meetings. KPI notes pinned next to the team's daily chat and tasks stay visible, get debated, and actually drive action.
Pair this with the broader stack and the agency dashboard becomes the operational floor underneath the rest. The KPI framework covers the discipline of what counts as a KPI. The vanity metrics deep dive covers what to cut. For function-specific KPIs, see marketing KPIs and sales KPIs; billable hours covers the operational input layer. The OKR vs KPI guide covers the operational handoff. SWOT, Strategic Choice Cascade, and PESTEL cover the strategic direction the dashboard is supposed to track against.
Pin the five KPIs alongside the work that moves them. Rock combines chat, tasks, and notes in one workspace. One flat price, unlimited users. Get started for free.
Most workplace friction is not caused by what people say. It is caused by how they say it. The same message lands as helpful, threatening, or vague depending on which of the four communication styles the speaker is leaning on. Knowing which style is in the room is the difference between resolving a disagreement in a 5-minute conversation and watching it ferment for three weeks.
This guide covers the four styles psychologists agree on, when each one helps or backfires, and how to adapt when you spot one across the table or the chat thread. Run the quick quiz below to find your own dominant style, then use the rest of the article to handle teammates whose default lean is different from yours.
What is your style? · 5 questions~60 seconds
Communication style is the layer underneath the words. Same message, four different deliveries.
What are communication styles?
Communication styles are the patterns in how someone delivers a message: the words they pick, the tone they use, and the body language that comes with it. Researchers and frameworks like Princeton UMatter have settled on four main styles for workplace work: assertive, passive, aggressive, and passive-aggressive. The names map to a single underlying question: how does the speaker handle their own needs versus the needs of the person on the other side?
Assertive speakers honor both. Passive speakers honor the other person at the cost of themselves. Aggressive speakers honor themselves at the cost of the other person. Passive-aggressive speakers want to honor themselves but route the request indirectly so it never quite gets named.
None of the four is a fixed personality trait. The same person uses different styles with their manager, their peers, and their family. The point of the framework is not labeling humans. It is naming the style in front of you in the moment, so you can react to it without taking the delivery personally.
"Most of us grew up speaking a language that encourages us to label, compare, demand, and pronounce judgments rather than to be aware of what we are feeling and needing." - Marshall Rosenberg, Author of Nonviolent Communication
The 4 styles compared at a glance
The fastest way to spot a style is to listen for the phrasing and watch the body language. Here is a side-by-side reference for the four. We unpack each below, but most readers find that this table answers 80% of the "what am I dealing with right now" question on its own.
Style
What it sounds like
Body language
Workplace impact
Assertive
"I cannot ship by Friday without dropping X. Which would you like me to drop?"Direct, factual, owns the position
Steady eye contact, open posture, even tone
Highest trust over time. Hard truths land because they come with respect
Passive
"Whatever works for the team is fine with me."Defers, even when an opinion exists
Avoids eye contact, smaller body posture, soft voice
Decisions made without their input, opinions surface late, resentment builds
Aggressive
"This is unrealistic. You need to figure it out."Blames, loud, attacks the person
Pointed gestures, raised voice, leaning forward
Decisions move fast, trust erodes, people stop volunteering ideas
Passive-aggressive
"No worries at all" then ignores follow-upsSurface agreement, indirect resistance
Tight smile, sarcasm, sighing, sudden silence
Original disagreement never resolved, team trust erodes quietly
Why assertive is the workplace default
Most workplace research treats assertive communication as the gold standard, and there is a reason. Assertive speech is the only style that respects both sides of the conversation at once. It is direct enough to actually move work forward, and it is calibrated enough to keep the relationship intact for next week.
An assertive teammate names the issue, owns their own position, and invites a response. "I cannot ship by Friday without dropping X. Which would you prefer I drop?" carries the same information as a passive "I will see what I can do" or an aggressive "you are setting an unrealistic deadline." But only the assertive version produces a decision instead of a delay or a fight.
The catch is that assertiveness is partly an environmental product. People speak up directly in environments where speaking up directly is rewarded, or at least not punished. Harvard Business School professor Amy Edmondson has spent two decades documenting this. Teams without psychological safety do not produce assertive speakers, even when the individuals would prefer to be assertive. The team learns silence.
"Uncertainty and interdependence are attributes of most work today. Without an ability to be candid, to ask for help, to share mistakes, we won't get things done." - Amy Edmondson, Harvard Business School Professor
Assertive speech is direct without being attacking. The substance lands, the relationship survives.
If you are a manager, the takeaway is that you cannot demand assertive speech without first building the conditions for it. Public credit for direct comments, no political consequences for disagreement, and a record of leaders being assertive themselves are the three signals teams watch. The opening question of your team meeting matters more than the agenda. It tells the room what kind of speech is welcome.
How to handle each communicator
You do not get to pick the style of the person across from you. You only pick how you respond. Here is how to work productively with each of the other three styles when they show up.
Working with passive communicators
Passive communicators have opinions. They just do not volunteer them. Most often this is a safety call, not a personality trait. Bring the opinion out by asking specific questions instead of open ones. "Do you agree with the proposed deadline" is a yes-no answer. "What would you change about the proposed deadline if you had to ship it" forces a response with substance.
Give them written channels. Many passive speakers do better in asynchronous formats where they can think before responding. Slack threads, comment fields, and async docs surface opinions that would never appear in a live meeting. Build the habit of asking for written input before group discussions, not after.
Passive communicators thrive when there is space for a written response and no penalty for the answer.
Working with aggressive communicators
Aggressive communicators usually have the right substance and the wrong delivery. Engaging the delivery is a trap. Match the substance, drop the heat. "You are right that the timeline is tight. Here is what I can move" tells them you heard the real thing without rewarding the tone.
Set written norms for hot threads. If the conversation is escalating in a chat or email, propose a 30-minute pause before the next reply. Aggressive speakers are often reacting to time pressure as much as to the issue. A short cool-down preserves the relationship without losing the substance. For long, repeating tone clashes, move the conversation to a one-on-one. Public escalation rewards the aggression by giving it an audience.
Working with passive-aggressive communicators
Passive-aggressive speech is the hardest to handle because the disagreement never appears where it can be addressed. The fix is to surface the underlying issue gently and directly. "I want to make sure I caught what you meant earlier. Were you saying you disagree with the approach? It is fine if you do."
Make it cheap to disagree. The reason most passive-aggressive behavior exists is that direct disagreement felt expensive in some past room. If you reduce the cost (no follow-up consequence, no pile-on, a clear thank-you for the input) the same person often shifts toward assertive speech within a few cycles. Patience is part of the job.
Pairing with another assertive communicator
Two assertive communicators is mostly a gift, but they can over-collide if neither pauses to actively listen. The fix is to make space for the other side to finish. Brené Brown captures the principle as "what is left unsaid" matters as much as what is said. Active listening, summarizing back, and explicit agreement on next steps are how assertive pairs avoid collapsing into two parallel monologues.
What shapes someone's style
Communication style is not a fixed trait. It is the output of culture, role, gender expectations, and the specific room someone is sitting in. Naming what is shaping the style helps you stop attributing the behavior to the person and start attributing it to the situation.
Culture. High-context cultures (East Asia, parts of Latin America, Indigenous traditions) communicate meaning indirectly through shared context and what is not said. Low-context cultures (US, Northern Europe) communicate explicitly through what is said. A direct comment that reads as assertive in Berlin can read as aggressive in Tokyo. Same speech, different style label.
Gender. Research on workplace assertiveness consistently shows the same direct comment gets read differently depending on who delivers it. Women are more likely to face penalties for assertive speech that men do not. The fix is structural (review processes that flag tone-of-voice patterns), not individual.
Role. Senior leaders have permission to be more assertive than junior staff. New hires lean passive in their first 90 days because the cost of being wrong feels higher. Calibrate expectations to the role. Punishing a junior for under-asserting in week two is its own kind of mistake.
Communication style adapts to the room. Cross-functional groups tend to surface more style variation than tight-knit teams.
Psychological safety. The biggest single driver. Teams with high safety produce assertive speakers across roles, genders, and cultures. Teams without it default to passive or passive-aggressive almost regardless of who is in the room. If your team is leaning passive across the board, the team itself is the variable, not the people.
Communication styles in remote and async work
Remote and async work compress communication into text. That changes the math on every style. Tone is missing, replies arrive hours apart, and small phrasing reads as colder than intended. Some styles benefit, others struggle.
Passive communicators usually do better in writing. The pause to type and the option to draft and revise removes the live-meeting pressure that pushes them to defer. Async client conversations often surface input that the same person would never have shared in a video call.
Aggressive communicators usually struggle. Without face-to-face cues, the directness reads as colder than intended. The fix is to lead written messages with one line of context before the request. "I know we are tight on time. Can we move the deadline by 48 hours?" lands differently than just the second sentence on its own.
Passive-aggressive behavior amplifies in async. The lack of direct conversation makes it easier to soften up front and route the actual disagreement somewhere else (DMs, group chats, hallway talk). The remedy is to keep important disagreements in the same shared space where the original message lived. Cross-team threads need explicit norms about where pushback belongs.
Async chat formats give passive communicators time to think; the same formats expose aggressive tone faster than live calls.
What we do at Rock for remote teams: we keep client and team conversations in shared spaces with both chat and tasks visible. The chat shows tone over time, which surfaces style patterns earlier than email threads do. The task board makes commitments explicit, which reduces the passive-style "I will see what I can do" phrasing that never resolves into a deadline. Moving conversations off email into a shared space is half the fix on its own.
The framework is straightforward, but a few mistakes show up over and over when teams try to apply it. Most are about treating communication style as a fixed personality label rather than a situational behavior to manage.
Reading directness as aggressionA teammate who says "this will not hit Friday, I need to drop X" is not being aggressive. They are being assertive. Penalizing assertive speech as if it were aggressive is the fastest way to push everyone toward passive or passive-aggressive default modes.
Expecting assertiveness without psychological safetyAssertive communication only works in rooms where speaking up does not get punished. If your last three direct comments led to a quiet review-cycle hit, the team learns silence. Fix the safety problem before the style problem.
Treating styles as fixed traitsMost people are mixes, and the same person communicates differently with their manager, their peers, and their clients. Naming a style is for the situation, not the human. The goal is awareness in the moment, not a personality label.
Defaulting to email for hard conversationsDifficult feedback, conflict, and disagreement land worse in writing than they do live. Tone is missing, replies arrive hours apart, and small phrasing reads as colder than intended. Use email for one-shot updates and broadcasts. Move conflict to a call or a chat space.
Confusing kindness with vagueness"It looks great" when it does not is not kind. It costs the receiver the chance to fix the work. Brené Brown puts it cleanly: clear is kind, unclear is unkind. Most "soft" feedback is actually unkind feedback dressed up.
The point of the four-style framework is awareness, not labels. When a teammate sounds aggressive, the question is rarely about the person. It is about what is happening in the room. Ask what is producing the aggressive speech, then pick one move to lower the heat without losing the substance. Most of the time the answer is patience and a one-on-one. For more on the surrounding system, the broader piece on team communication strategies covers the operating-rhythm side, and our notes on communicating with clients walk through the cross-stakeholder version.
Healthy team communication needs the right environment as much as the right words. Rock combines chat, tasks, and notes in one workspace where every conversation has context attached. One flat price, unlimited users. Get started for free.
Basecamp and Notion solve project work in opposite directions. Basecamp is a finished product. The opinions are baked in. To-dos, schedules, message boards, Hill Charts, and Campfire chat all live in one calm workspace, and you adjust your team to the tool. Notion is the opposite. It is building material. Pages, databases, and views give you the components, and you assemble your own project management system on top of them.
That single difference shapes everything else. This Basecamp vs Notion guide compares them honestly, axis by axis, and runs the real cost at 5, 15, and 30 seats. Some teams should pick Basecamp. Some should pick Notion. And some should pick neither because the chat-first workspace closer to how your team actually communicates lives somewhere else. Run the recommender below for a starting point.
Notion gives you a flexible workspace and asks you to build the system. Basecamp gives you the system and asks you to use it as designed.
Quick answer. Basecamp is opinionated project management with built-in messaging. Notion is a flexible workspace built around the page. Pick Basecamp if you want a calm, structured PM hub with chat included and minimal setup. Pick Notion if you want to build a real knowledge base and assemble your own task system on top. Pick neither if you want chat-first agency work with clients in the same space.
Want chat with your tasks and notes?
Rock combines all three in one workspace. One flat price, unlimited users.
Basecamp has been around since 2004 and has stayed close to one idea: project management should be calm. Each project gets a message board, to-do lists, a schedule, a chat room (Campfire), real-time pings, file storage, and Hill Charts for visualizing progress. The features are deliberately limited. There is no Gantt chart with cross-task dependencies, no time tracking on the base plan, and no AI.
That last point is intentional. 37signals, the company behind Basecamp, has been openly skeptical of bolting AI features onto every product. In late 2025, founder DHH wrote about Basecamp becoming agent-accessible. The reframe was direct. Instead of baking AI features in, 37signals revamped the API and added a CLI so external agents can drive Basecamp. The bet is that users will want to choose their own AI rather than have one chosen for them.
"Perfection is achieved, not when there is nothing more to add, but when there is nothing left to take away." - Antoine de Saint-Exupéry, Author of Wind, Sand and Stars
That quote captures Basecamp's product philosophy. The features are subtractive. Card Tables (lightweight Kanban) shipped in 2024. Hilltop View, which aggregates Hill Charts across projects, shipped in 2025. Each release adds one or two things and stays within the calm framework. Teams that want to onboard freelancers and clients without training appreciate that finished-product feel. Teams that want to build their own bespoke system find it limiting.
Notion takes the opposite approach. Every page is a flexible block-based document. Any page can become a database. Tables, kanban boards, calendars, and galleries are all views over the same data. The trade-off is that nothing comes pre-built. You decide what your project tracker looks like, what fields a task has, how docs are organized, and how teams navigate the workspace.
Product specs, engineering wikis, content calendars, OKR trackers, customer research libraries, and onboarding handbooks live well in Notion. The free plan is generous for individuals and small teams. Notion AI was bundled into the Business plan in May 2025, which means teams paying $20 per user per month or more get a writing assistant, summarization, action-item extraction, and Q&A across the workspace at no extra cost.
"We are stuck with technology when what we really want is just stuff that works." - Douglas Adams, Author of The Salmon of Doubt
Adams's line frames the trade-off well. Notion's flexibility is the product. The cost is that teams have to build a system before they can use it, and many teams build elaborate Notion workspaces that nobody but the original architect understands. For the broader field of options, see our Notion alternatives guide. For deeper PM-side comparisons, see Asana vs Notion, Asana vs Basecamp, Basecamp vs Monday, or Notion vs ClickUp head-to-head.
Notion's strength is the page. Wiki pages, linked databases, and synced blocks scale into a real knowledge base for teams willing to build the structure.
Basecamp vs Notion side-by-side
Five axes matter when picking between these tools. Philosophy, tasks and PM, docs and wiki, AI in 2026, and pricing. Here is how each one stacks up.
Feature
Basecamp
Notion
Philosophy
Opinionated, finished product
Flexible, building material
Best for
Async PM with built-in messaging
Knowledge bases, wikis, docs that do tasks
Tasks and PM
To-dos, schedules, Hill Charts, Card Tables
Light: tables and kanban via databases
Docs and wiki
Message boards and docs (basic)
Best in class for nested pages
Built-in chat
Yes (Campfire and Pings)
Comments only
AI in 2026
None native (deliberate). API-accessible to external agents
Notion AI bundled in Business plan (May 2025)
Free plan
1 project, 3 users, 1GB
Unlimited blocks, 7-day history
Paid from
Plus $15/user/mo, Pro Unlimited $299/mo flat
Plus $10/user/mo, Business $20/user/mo (annual)
Client access
Built-in client view
Guests on paid plans
Mobile
Strong
Functional, slower than desktop
Learning curve
Minimal
Steep
Philosophy: finished product vs building material
This is the spine of the Basecamp vs Notion comparison. Basecamp arrives with opinions. The features are decided, the layout is fixed, and the workflow is on rails. New teammates open it and know where to write a status update, where to add a to-do, where to start a chat. Onboarding takes minutes.
Notion arrives with components. Pages, databases, properties, views, relations, formulas. The team architect decides what a project tracker looks like, what a meeting note template includes, how the wiki nests. Onboarding takes longer because every workspace looks different. The flexibility is real and the trade-off is real.
For agency owners onboarding freelancers across time zones, the finished-product model wins. For founders who want to shape the workspace to match exactly how they think, the building-material model wins.
Tasks and project management
Basecamp ships with To-dos, Schedules, Card Tables (lightweight Kanban added in 2024), and Hill Charts for visualizing progress along uphill and downhill phases of work. The set is small and focused. There is no native Gantt chart, no resource workload view, and no time tracking on the standard tier.
Notion has no native PM features at all. Tasks are a database of pages with date and status fields. Teams build their own kanban or list views. Templates from the community fill some gaps, but the result is always a mimicry of dedicated PM tools rather than the real thing. For teams that need formal project management, Notion will frustrate within months.
If your work needs Gantt charts and dependencies, look at our ClickUp alternatives roundup or the Notion vs ClickUp comparison instead. Neither Basecamp nor Notion handles that well.
Docs and wiki
Notion wins decisively. The block-based editor, nested page hierarchy, linked databases, and synced blocks make Notion the strongest knowledge tool in the comparison. Teams that build wikis, product specs, and meeting note systems in Notion rarely move away because the doc experience itself is the product.
Basecamp's message boards and docs cover the basics. They handle short docs, decisions, and announcements well. They are not the place to build a 500-page wiki or a customer support knowledge base. Teams that want both async PM and a deep wiki end up running Basecamp plus Notion or Basecamp plus Confluence.
AI in 2026
This is the cleanest wedge between the two products. Notion went all-in on AI. Notion AI is bundled into the Business plan as part of the base subscription. Writing assistance, summarization, action-item extraction, Q&A across the workspace, and the Notion Agent feature are all included for teams paying $20 per user per month.
Basecamp went the opposite direction. 37signals deliberately ships no native AI features. The company has stated that they experimented with AI internally and chose not to ship most of what they built because it was not actually useful. Their public bet is on agent-accessibility instead: a revamped API and CLI so external agents (Claude, ChatGPT, Cursor, others) can drive Basecamp from the outside. Users bring their own AI rather than have one chosen for them.
This is a real philosophical split, and most ranking comparison articles have not caught up. If AI is part of how your team works, Notion's bundled approach is the smoother experience. If you want to choose your own AI tools or pay for none, Basecamp's stance is more aligned with how you operate.
Pricing model
Basecamp uses two pricing models. The Plus plan is $15 per user per month, which favors small teams. The Pro Unlimited plan is a flat $299 per month (annual billing) or $349 per month (monthly billing) for unlimited users, which favors teams above 20 people. Pricing details on basecamp.com/pricing.
Notion uses a per-user model. Plus is $10 per user per month on annual billing. Business is $20 per user per month with Notion AI bundled. Pricing details on notion.com/pricing.
The headline math depends on team size. We model that next.
Real cost at 5, 15, and 30 seats
Most comparison articles model 10 seats and stop. Below is the verified annual cost at 5, 15, 30, and 50 seats using 2026 list prices on annual billing. Rock is included as a flat-rate reference because the math gets interesting at the larger sizes.
Team size
Basecamp Plus
Basecamp Pro Unlimited
Notion Plus
Notion Business (incl. AI)
Rock Unlimited
5 people
$900
$3,588
$600
$1,200
$899
15 people
$2,700
$3,588
$1,800
$3,600
$899
30 people
$5,400
$3,588
$3,600
$7,200
$899
50 people
$9,000
$3,588
$6,000
$12,000
$899
Three things stand out. First, Notion Plus is the cheapest paid option below 12 people, and Basecamp Plus is the most expensive. Second, Basecamp Pro Unlimited at $3,588 per year stays flat regardless of team size, which makes it cheaper than Basecamp Plus once you cross 20 people. Third, Rock at $899 per year on annual billing is cheaper than every option in this table at every team size from 5 to 50.
The breakeven math: at 5 people, Notion Plus ($600) beats Rock ($899) and both beat Basecamp options. Past 9 people on Notion Plus or 7 people on Basecamp Plus, Rock costs less. Past 20 people, Basecamp Pro Unlimited becomes the better Basecamp option but is still 4× the cost of Rock.
None of this matters if the wrong tool is wrong for the work. Pricing alone is a bad reason to switch. But the Notion vs Basecamp pricing question combined with which philosophy fits your team shapes the decision. For more cost-modeling against the broader category, see our Notion vs Trello and task management apps guides.
When to pick Basecamp
Basecamp is the right pick for teams that want calm, opinionated project management with chat included. Some specific cases.
Async-first agencies and consultancies. The message board format encourages thoughtful written updates instead of rapid-fire chat. Hill Charts give a sense of progress without daily status meetings. The whole product is shaped around how async teams actually work.
Teams that bring clients into projects. Basecamp's client-access mode hides internal threads and gives clients a curated view of project progress. The flow is built in, not bolted on. For agencies that ran into Notion's guest-seat fees or Trello's permission complexity, Basecamp is a relief.
Teams that prefer no AI. If you want a tool that does not push you to use AI features, Basecamp is rare in the modern PM market. The 37signals stance on AI is genuine, not marketing.
Teams larger than 20 with a flat-rate preference. Pro Unlimited at $3,588 per year covers any number of users. Compared with Notion Plus at 30 people ($3,600), Basecamp Pro Unlimited matches the cost and adds built-in messaging.
Skip Basecamp if. You need formal project management with Gantt charts and dependencies. You write more than you ship and need a deep wiki. Or you want native AI as part of the daily flow.
When to pick Notion
Notion is the right pick for teams that lead with writing and want to build a system. Some specific cases.
Doc-heavy product and content teams. Product specs, engineering wikis, editorial calendars, content briefs, and customer research libraries fit Notion's flexibility. The page-and-database model handles these out of the box. See communication strategies for how doc-led teams structure async work.
Teams that want native AI bundled into the price. Since May 2025, Notion AI is included in the Business plan at no extra cost. For teams that will use AI heavily, this is meaningfully cheaper than ClickUp Brain or other AI add-ons.
Solo founders and small teams that want one tool. Notion can be a personal CRM, a project tracker, a journal, and a wiki at the same time. Few tools can. Below 10 people the per-seat cost is reasonable.
Knowledge bases that get heavy daily use. Customer support docs, internal HR handbooks, onboarding wikis, and policy libraries earn back the setup time within weeks.
Skip Notion if. You want a tool running today without configuration. You need formal project management. Your team will not invest the time to build a system before using it. Or you have outgrown the per-seat pricing model.
That third option, simply.
Rock pairs chat with tasks and notes. Built for client work, free for small teams.
Basecamp and Rock are closer to each other than most pairs in this comparison cluster. Both are flat-priced at scale. Both bundle messaging, tasks, and notes. Both target async-leaning teams. So this section starts with honesty.
Where Basecamp wins over Rock. Hill Charts as a unique progress visualization. The Shape Up methodology coupling for product teams. A 25-year track record and brand trust that matters to some clients. A built-in client-access flow that hides internal threads with one toggle. Campfire chat plus Pings come included.
Where Rock wins over Basecamp. Flat pricing of $899 per year on annual billing versus Basecamp Pro Unlimited at $3,588 per year. Modern threaded chat closer to dedicated tools like the Slack-tier messengers than Basecamp's Campfire. Task view flexibility (Kanban, list, sprint, calendar) versus Basecamp's smaller view set. Stronger fit for the SEA, Latam, and Africa connectivity profile because of Rock's mobile and offline behavior. Clients and freelancers join spaces directly without per-seat fees, which Basecamp also handles but at the higher price tier.
Where they are similar enough that brand preference decides. Both are flat-priced at scale. Both treat messaging as a first-class feature. Both deliberately limit AI: Basecamp ships none natively, Rock supports any AI through a custom API. Both work for async-first agency teams.
"There are only two ways to make money in business: bundling and unbundling." - Jim Barksdale, Former CEO of Netscape
The honest read is straightforward. For a 5-person agency, Basecamp Plus at $75 per month and Rock at $89 per month are close enough on price. Brand trust and client-access flow may legitimately tip toward Basecamp at that size. For a 15-person agency, Rock at $899 per year against Basecamp Pro Unlimited at $3,588 per year is a different conversation. The same is true at 30 people, where the math gap funds a part-time role.
Rock is also not the right tool for everyone in this comparison. If your work depends on Notion-style relational databases or deeply nested wiki pages, Notion remains the right pick. If your work depends on Hill Charts and Shape Up, Basecamp does that and Rock does not. The Notion vs Basecamp question is real for a real subset of teams, and Rock fits a different subset that wants chat-first work without the per-seat tax.
If you want to test the chat-first model on real work, the free plan covers 3 group spaces with 5 members each. That is enough to run a project end to end with the team. Compare against your current Basecamp or Notion plus a chat tool monthly cost. See our instant messaging apps guide for the broader chat-first context.
FAQ
Is Basecamp better than Notion? Neither is universally better. They are built around opposite philosophies. Basecamp is opinionated project management with messaging, schedules, and Hill Charts baked in. Notion is a flexible workspace where you build your own system. Pick Basecamp for calm async PM with low setup. Pick Notion for knowledge bases and doc-heavy work.
Can Notion replace Basecamp? For small doc-heavy teams that want everything in one workspace, yes. Notion has database-driven task views, comments, and a board view. The trade-off is setup time and the absence of native chat. Basecamp gives you Campfire, Pings, schedules, and Hill Charts out of the box. Notion gives you a blank canvas and templates. For teams that value finished workflows over flexibility, Basecamp stays simpler.
Does Basecamp have AI? Not natively, by design. 37signals has been publicly skeptical of AI as a baked-in feature and chose to make Basecamp agent-accessible instead. The company shipped a revamped API and CLI in late 2025 and early 2026 so external AI agents can drive Basecamp without features being added inside the product. Notion went the other direction and bundled Notion AI into the Business plan in May 2025.
Is Basecamp worth it in 2026? Yes for teams that match the calm, async, opinionated philosophy. The product is actively maintained, with Card Tables added in 2024 and Hilltop View in 2025. The 25-year track record matters for client trust. The flat $299 per month Pro Unlimited tier remains one of the cleanest pricing models in the category. Worth it depends on whether the philosophy fits, not whether the product is alive.
What are Hill Charts? Hill Charts are a Basecamp-specific way of visualizing project progress. Each task or piece of work is a dot on a hill. The uphill side represents figuring out what to do, the downhill side represents executing on that plan. The chart updates over time as the team moves dots, which gives stakeholders a sense of momentum that traditional Gantt charts miss. Hill Charts are unique to Basecamp and are part of why some teams stay even after trying alternatives.
Want one workspace where chat, tasks, and notes live together? Rock combines all three with flat pricing for unlimited users. Get started for free.