By clicking Accept, you agree to the storing of cookies on your device to enhance site navigation, analyze site usage, and assist in our marketing efforts. View our Privacy Policy or manage preferences.
Oops! Something went wrong while submitting the form.
or continue with
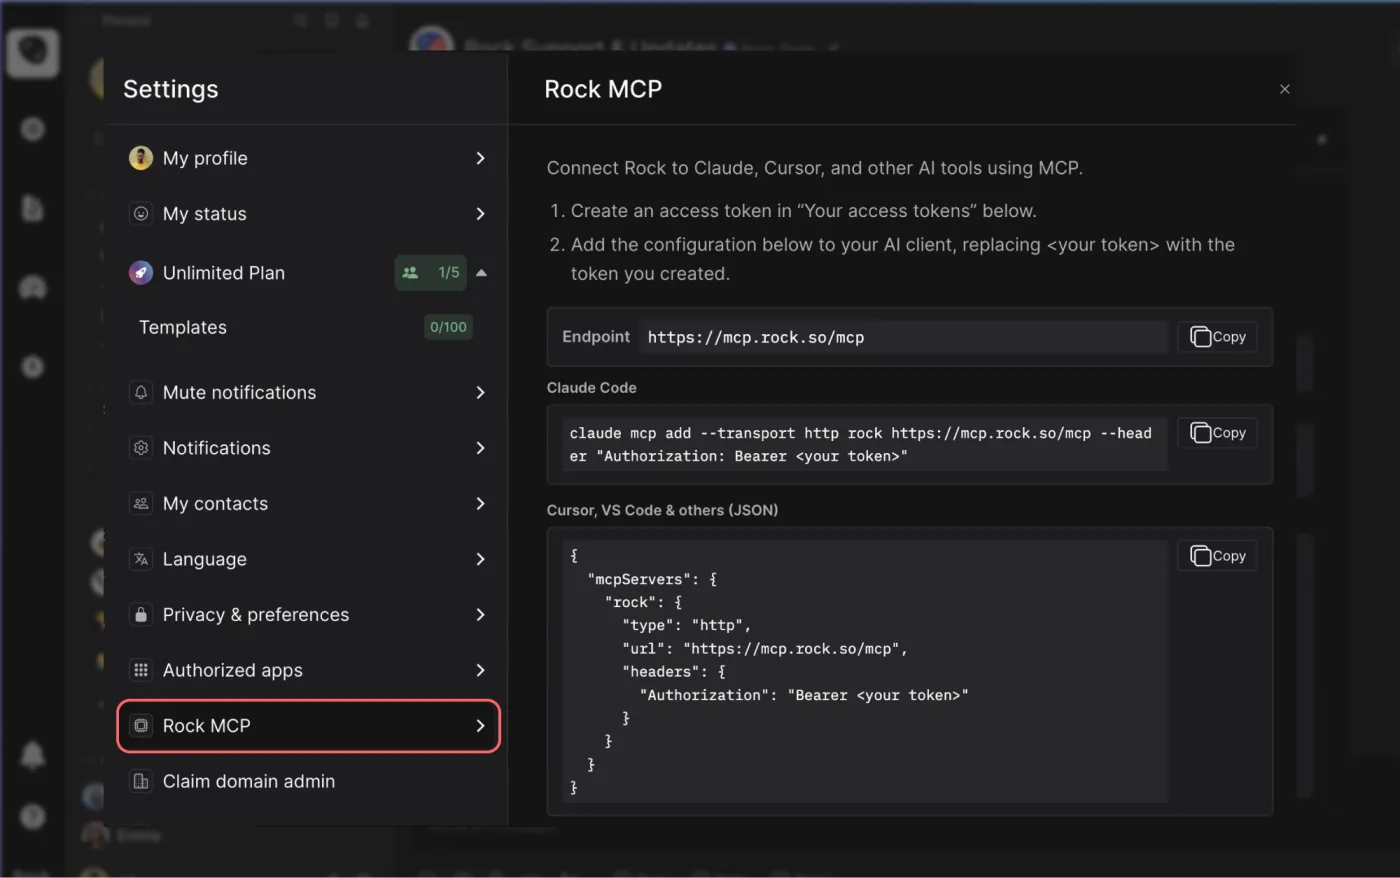
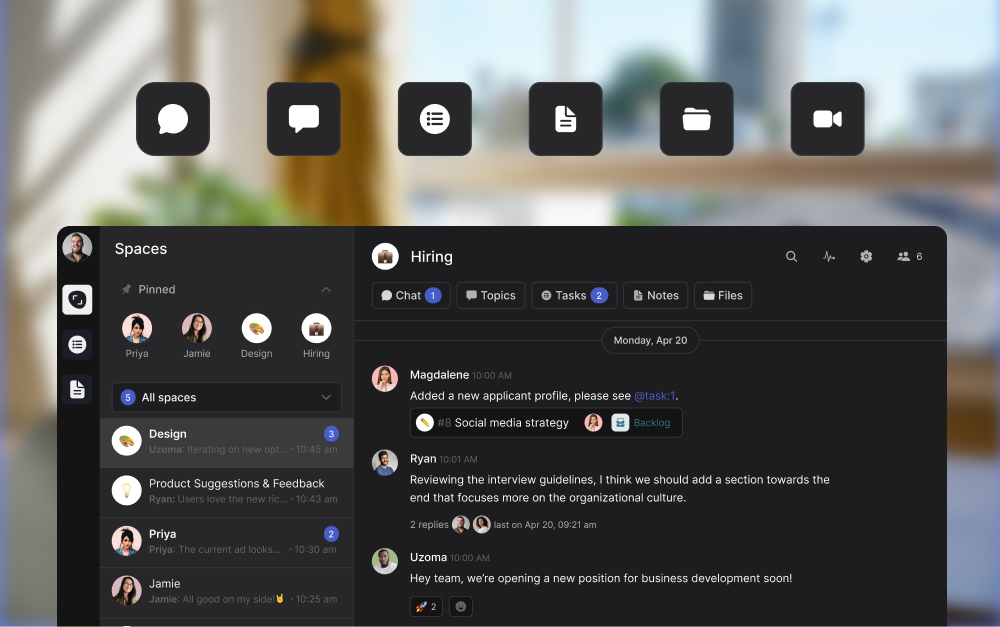
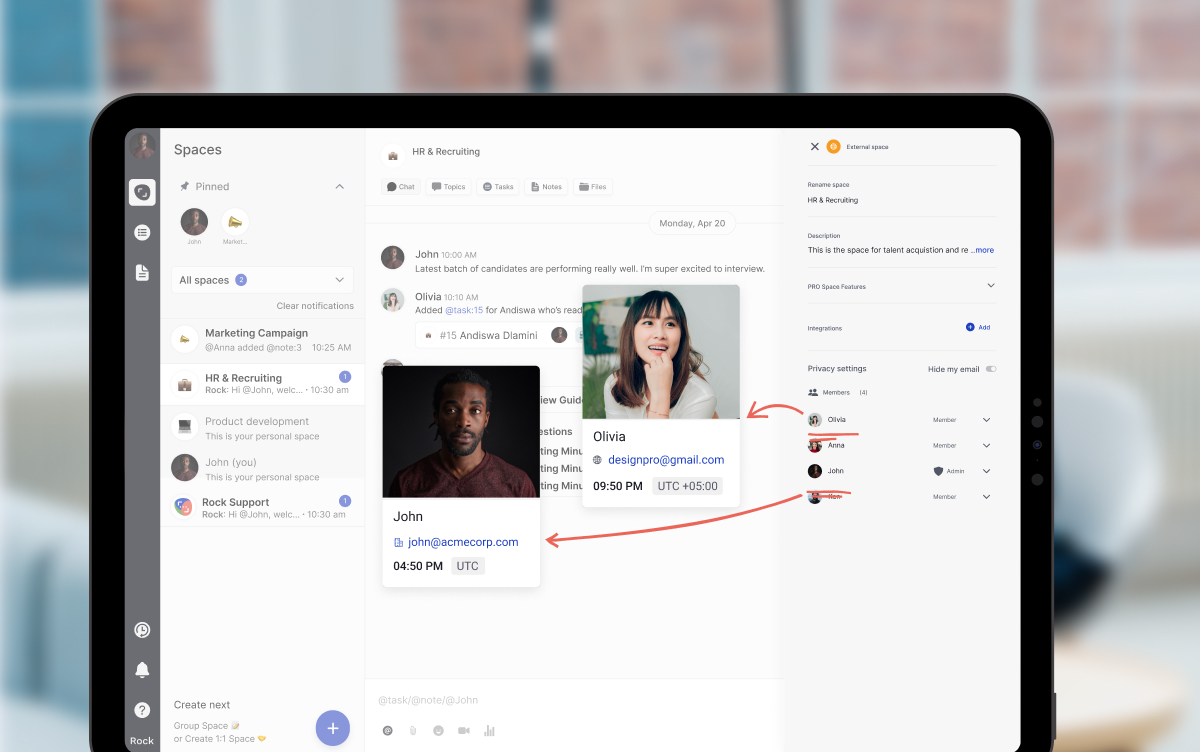
Rock MCP is here. You can now connect Rock to the AI tools you already use. Create a token in Rock, paste it into Claude, Cursor, or another client, and the assistant works inside your spaces as you, across all of them at once.
From earlier calls this month we learned that a lot of our active teams live in tools like Claude and Cursor now, and you would rather they reach into Rock than have you copy things back and forth. We work the same way.
Rock MCP is that connection: your AI assistant reads and updates your spaces directly, making it easier to stay up to date and manage projects across team members.
A few things worth knowing:
It works today with Claude Desktop, Claude Code, Codex, Cursor, VS Code, and Claude Cowork. A one-click connector for Claude on the web and mobile is coming next.
The token acts as you, read and write, across all your spaces. Treat it like a password, and revoke it any time.
It is on every plan, including Free.
Easiest setup: just ask Cowork
Claude Cowork can help you end-to-end with the setup. Share the prompt below and generate a new token, Claude will guide you through all steps.
Keep your token safe, never share in chat.
zsh
Works in coding environments
Add Rock MCP to Claude Code, Codex, Cursor, VS Code, or right from the terminal.
You will find it under your avatar, in a settings panel called Rock MCP. Full setup for every client is in the help guide.
What we use it for
A few of the things we ask it every day:
Search across your whole account. One question searches tasks, notes, and chat messages in every space you belong to. Try "where did we land on the Q3 pricing change?" or "find the onboarding brief and summarize it."
Turn a transcript or doc into tasks. Paste a meeting transcript or point it at a document, and ask it to create the tasks, with owners, due dates, and descriptions already filled in.
Push updates in. Drop your latest growth numbers, funnel metrics, or a status note straight into the right space, so the team sees it where they already work.
Run your to-do list from the chat. Ask "what is my most urgent task?", work on it together, then mark it done or update it without opening the app.
Plus, recent fixes
Since our last update, we also shipped:
Cleaner notifications and unread counts. Unread dots clear correctly for archived spaces and after "Mark all as read," and counts update the moment you open an item.
DMs in custom folders no longer disappear from your sidebar.
Chat threads stay in the right space now, with no more cross-space mix-up when you open one.
Add Spaces picker now targets the correct workspace inside embeds.
Inbox Zero gets misread the moment people hear the name. Most articles, including the ones at the top of Google, treat it as a discipline of emptying the inbox each day. The originator was clear that this is not the point.
This guide covers what Inbox Zero actually means in Mann's original framing, the five actions that make up the method, and how to run it in Gmail or Outlook. It also covers where the method holds up in 2026, and where it breaks. The widget below lets you run a quick triage simulator first; most of the value is in the doing, not the reading.
Quick answer: what Inbox Zero means
Inbox Zero is a method created by Merlin Mann in 2006 and 2007 for processing email without letting it consume your attention. The "zero" refers to zero time your brain spends in the inbox between processing windows, not zero messages waiting in it. The method works by triaging each email through five distinct actions: Delete, Delegate, Respond, Defer, or Do.
Mann himself was direct about the misread. The point is to stop email from running your day, not to perform a clean inbox at 5pm. Most of the productivity gain comes from running the method in batched windows with notifications off, rather than from any specific organizing system.
5 D's Email Triage Simulator
Decide what to do with 7 sample emails. The simulator shows whether your triage instincts match Mann's original method, and where they drift.
The simulator above teaches the rhythm faster than reading does. The 5 D's table further down shows when each action applies and the typical mistake to avoid.
What Inbox Zero actually means (in Mann's words)
Mann coined the term in a 43folders.com blog series in 2006 and gave the canonical talk at Google in July 2007. The framing is consistent across both: email processing should not require continuous attention, and the productivity cost of an inbox is not measured in unread count but in cognitive time.
"It is not how many messages are in your inbox. It is how much of your own brain is in that inbox." - Merlin Mann, Inbox Zero Google Tech Talk, July 2007
Mann was equally direct that "as a knowledge worker, the two most precious things you have are your time and your attention." Email vendors and most productivity blogs have spent the years since rewriting the method as five steps to an empty inbox. That is the literal misread; the spirit is that email should occupy as little of your attention as possible, processed deliberately in dedicated windows, not continuously.
This matters because the literal interpretation produces the wrong behaviors. Constant inbox checking to keep the count near zero is the opposite of what Mann recommended. Reaching empty inbox by half-reading 80 messages in 20 minutes is not Inbox Zero either. It is performance triage that costs more attention than letting the inbox sit until the next batched window.
The 5 D's: Delete, Delegate, Respond, Defer, Do
The method is five actions, applied to every email in turn during a processing window. There is no sixth action. There is no "leave it for later" that does not map to one of these. Most of the discipline is choosing the right D quickly, then moving to the next email.
Action
Use it when
The mistake to avoid
Delete
The email has no value to you, your team, or your records. Newsletters you stopped reading, app digests, phishing, FYI threads with no action.
Hesitating. Most low-signal email gets archived "just in case" and accumulates as background noise.
Delegate
The email needs an action, but you are not the right owner. Forward to the right person and archive.
Forwarding without context. A two-line note explaining what is needed saves the receiver from re-reading the whole thread.
Respond
A reply is the action, and it takes under two minutes. Allen's two-minute rule applies cleanly here.
Letting two-minute replies pile up. Each one carries its own context-switching cost; batching 30 of them is its own focus killer.
Defer
The email needs a real action longer than two minutes. Capture the action in your task system, schedule a focus block, and archive the email.
Leaving it in the inbox to drift. Deferred emails that stay in the inbox become a second to-do list with no priority logic.
Do
The action is small, owned by you, and can be done now without disrupting deeper work. Approving an invoice, confirming a meeting time, sending a quick file.
Confusing Do with Respond. Do means take an action outside the inbox; Respond means the reply itself is the action.
Some popular accounts collapse the framework to four D's by merging Respond into Do or Defer. Mann's original method has five, and the distinction between Respond and Do is doing real work. Respond means the reply itself is the action. Do means the action lives outside the inbox: approving, paying, scheduling, sending a file. Lumping them together hides the question that should drive the choice.
"If the next action can be done in two minutes or less, do it when you first pick the item up. Even if that item is not a high priority, do it now if you are ever going to do it at all." - David Allen, Getting Things Done
Allen's two-minute rule is the principle behind Respond. Anything longer becomes a Defer with the action captured in your task system, not a longer Respond that bleeds into focus time.
How to do Inbox Zero (Gmail and Outlook)
The method does not need a specific email client; it needs a specific cadence. The steps below assume Gmail or Outlook, the two clients covering most knowledge workers, but the moves translate to any inbox.
Set two daily processing windowsBlock 20 to 30 minutes in the morning and 15 minutes at the end of the day on the calendar. Outside those windows, the email tab stays closed. The discipline is not about willpower; it is about creating windows that produce decisions, instead of letting the inbox produce decisions for you.
Turn off email notifications system-wideDesktop, mobile, browser. Each ping is an unforced context switch. The triage windows are the only access points. Most teams find that nothing breaks; the few cases that genuinely need real-time attention should not have been email in the first place.
Apply the 5 D's, top to bottomOpen the oldest unread first. For each: Delete, Delegate, Respond (under two minutes), Defer (capture in tasks, archive the email), or Do (the action lives outside the inbox). One pass, no second-guessing. The first time it takes longer; by the third or fourth window the rhythm sets.
Build filters for low-decision emailNewsletters, app digests, recurring vendor notifications: filter to a folder labeled "Read later" or "Receipts." This is not deferral; it is removing repetitive triage decisions altogether. Review the folder once a week, not daily.
Move conversations off email when possibleIf the same colleague emails you 10 times a day, the fix is not better triage; it is moving that conversation to chat. Inbox Zero only works if the inbox is for the kind of work that actually belongs there: external messages, formal records, and one-to-one threads with people you do not chat with daily.
Audit weekly, adjust the rhythmAfter two weeks, look at the pattern. Are the windows enough? Did anything important slip? The right cadence is the smallest one that does not break communication. For some roles that is twice a day; for client-facing roles it might be four windows; for deep-work roles it might be once a day.
One detail surprises most people. The time investment of Inbox Zero, run properly, is roughly 30 to 45 minutes per day, not the multiple hours a continuously checked inbox consumes. The savings come from removing the dozens of micro-context-switches a constant inbox creates, not from doing email faster.
Solo, team, executive: different versions
Inbox Zero works differently depending on the role. The most common reason people abandon the method is applying the solo version to a role that needs the executive version, or vice versa.
Use case
Realistic target
Sustainable rhythm
Solo / individual contributor
Empty inbox once a day. Most days, briefly. Some days, not at all.
Two batched processing windows: morning kickoff and end-of-day. Notifications off in between.
Team contributor on a small team
Triage to single digits twice daily. Empty is a bonus, not the goal.
Three windows: morning, post-lunch, end-of-day. Slack or chat handles same-day coordination instead of email.
Manager / project lead
Triage to under 20 unread daily. Many threads stay open as ongoing context.
Process 3-4 times during the day in 10-minute windows; longer batched reply sessions for substantive responses.
Executive / client-facing role
Empty is unrealistic; the right metric is response-time on what matters, not unread count.
Continuous triage with strict Delegate-first habit; an executive assistant or shared inbox for delegation reduces the load further.
Agency owner with multiple clients
Per-client folder triage; empty inbox per client matters less than per-client response SLA.
Filters route by client; reply windows align with client time zones; non-client email batched once daily.
The agency-owner row in particular tends to surprise people. Running Inbox Zero across multiple client retainers is rarely about reaching empty; it is about per-client triage discipline so the right client never waits longer than the SLA promised. That is the realistic version of the method for the role.
What Inbox Zero is not (the 2026 reality)
Modern email volume is genuinely higher than when Mann coined the term. Microsoft's 2024 Work Trend Index found knowledge workers receive 117 emails per day on average, are interrupted every two minutes, and that 48% feel work is fragmented and chaotic. McKinsey's earlier Social Economy research found knowledge workers spend roughly 28% of their workweek on email, the equivalent of 13 hours.
The volume is real, and pretending the original method scales unchanged to those numbers is dishonest. What still works at 2026 volume:
The principle. Zero attention between processing windows. Notifications off. Batched triage. This is more important now, not less.
The 5 D's. The action set covers everything regardless of volume. Higher volume means more decisions per window, not different decisions.
Filters and aggressive deletion. Most of the volume increase is automated email: app digests, vendor updates, marketing. Rules and filters route this without triage; the human inbox stays at human-scale volume.
What does not survive 2026 unchanged is the mental model of email as the primary work channel. Much of the email volume that makes Inbox Zero feel impossible should not have been email in the first place.
"Knowledge workers increasingly replace deep work with the shallow alternative, constantly sending and receiving emails like human network routers, with frequent breaks for quick hits of distraction." - Cal Newport, Deep Work (Grand Central Publishing, 2016)
What we recommend (the better question)
Most of what makes Inbox Zero feel impossible in 2026 is not better email triage; it is conversations sitting in email that should be in chat, in a shared task tool, or in a workspace where context lives next to the work. Better triage at higher volume only buys back so much.
The bridge is to two pieces Rock has covered separately. The Pomodoro Technique covers individual focus discipline. The cost of context switching covers the structural case against constant inbox attention. Inbox Zero is the email-specific version of the same idea.
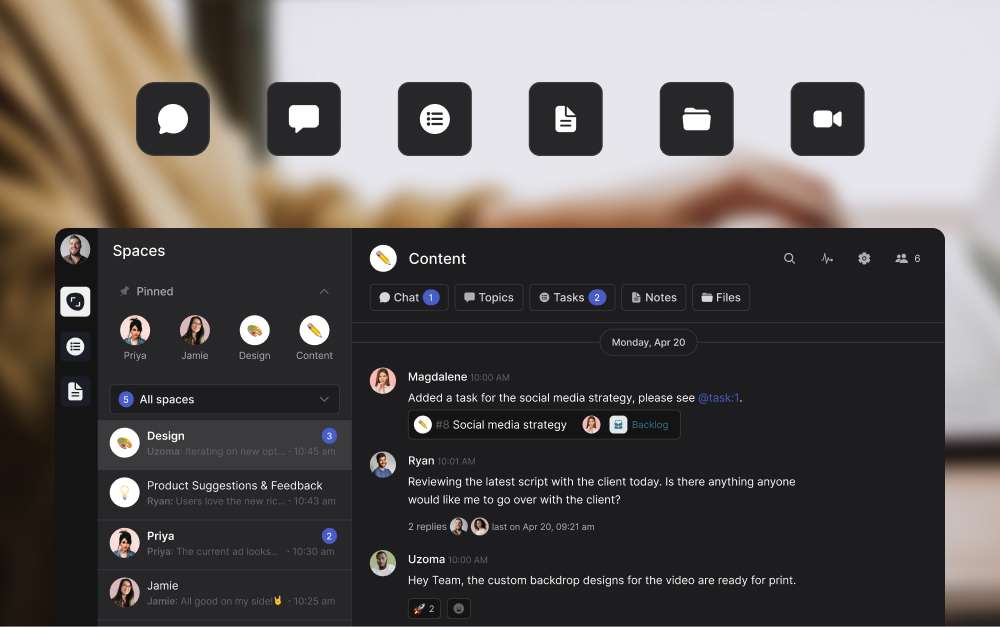
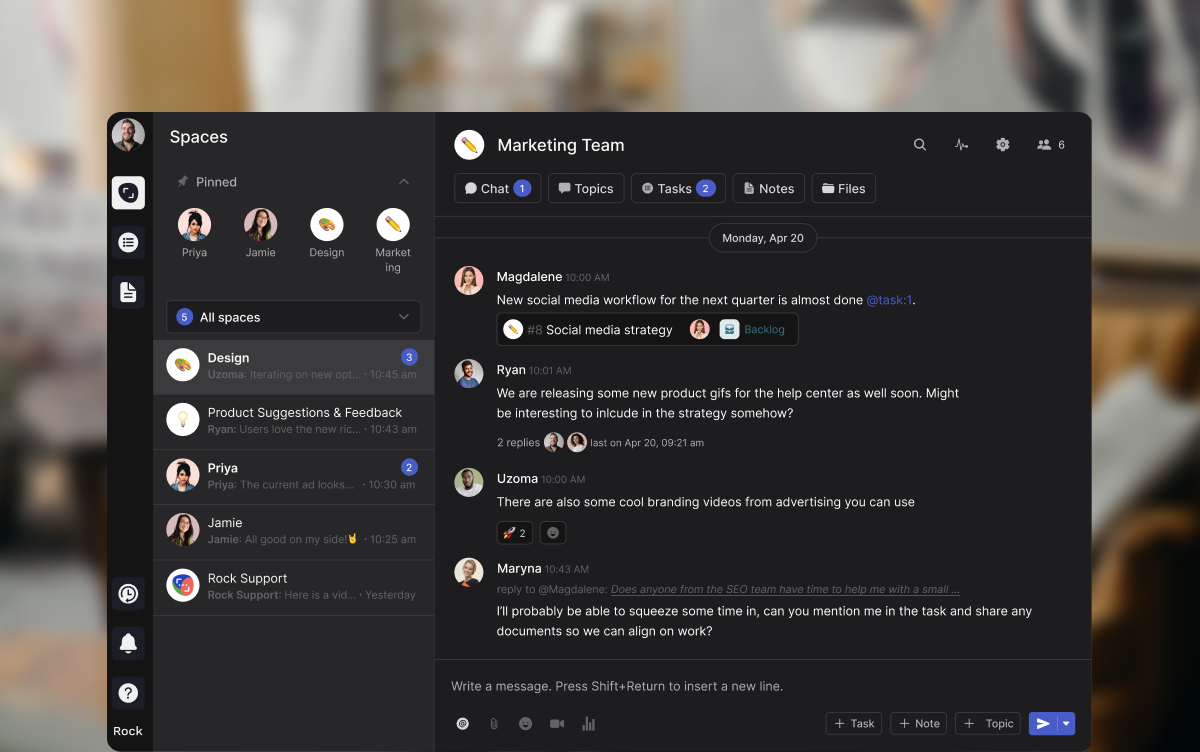
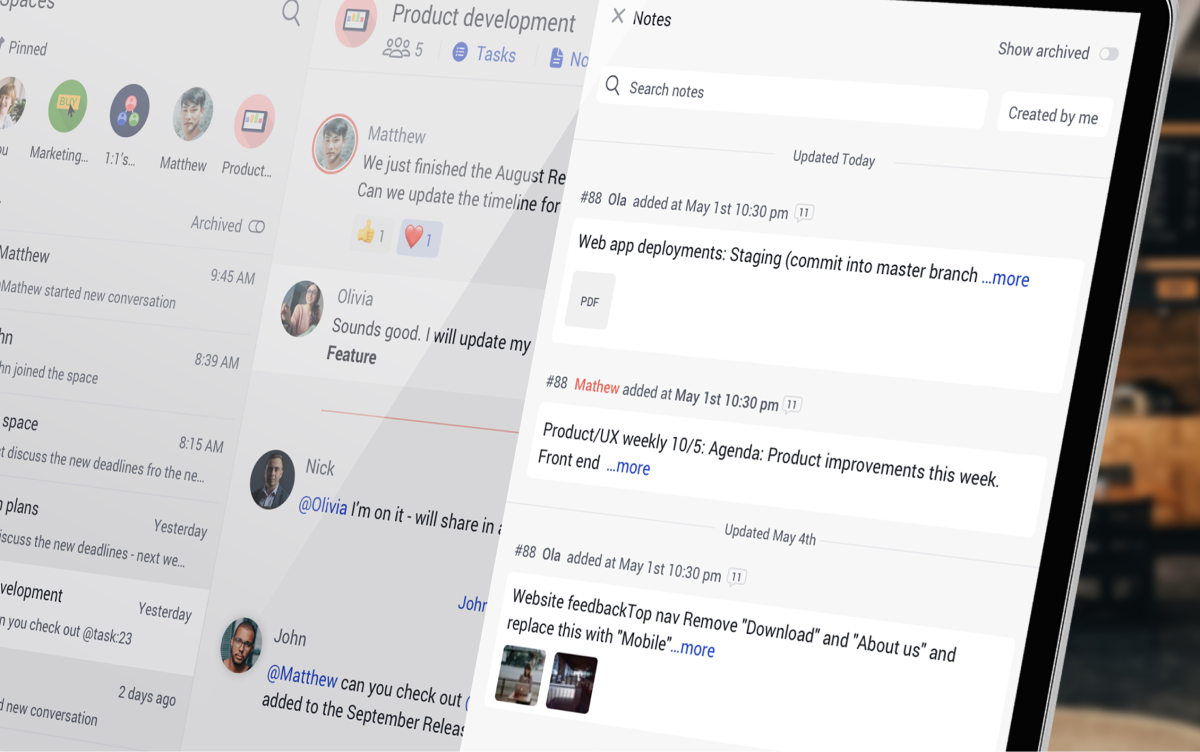
What we do at Rock: chat, tasks, and notes live in the same workspace, so most same-team conversations never become email at all. Topics let threads branch from a main chat without spawning new channels for each. Set Aside lets a teammate flag your message for later instead of forcing a real-time answer.
The result is fewer emails to triage, not faster triage. The same Inbox Zero principle (zero attention between windows) applied upstream of the inbox itself.
Topics let same-team conversations stay organized in one workspace, reducing the email volume that triage has to absorb.
Common pitfalls
The most predictable failure modes when teams or individuals try to adopt Inbox Zero.
Treating empty inbox as the goalMann's whole point was that "zero" refers to the time your brain spends in the inbox, not the message count. Reaching empty inbox at 5pm by half-reading 80 messages is not Inbox Zero; it is performative triage that costs more attention than it saves.
Confusing Defer with leaving it in the inboxDefer means the action is captured somewhere you actually look at, like a task system or a calendar block. An email "deferred" by sitting in the inbox is just an email. The discipline is moving the commitment out, then archiving the source message.
Skipping the Delegate DMany people default to Respond or Do for emails that should have been Delegated. Two-minute self-replies feel productive but accumulate. If a teammate or assistant is the right owner, forwarding with two lines of context is the whole job.
Treating chat the same as emailInbox Zero on email plus 200 unread Slack pings is not focus; it is the same problem in a different tool. The principle (your brain in the inbox is the cost) applies to every constant-attention channel, with the same fix: batched windows, fewer notifications, clearer ownership.
Maintaining 14 folders that nobody usesElaborate folder hierarchies are inbox theater. Modern email search is good enough that two or three folders (Receipts, Read Later, Archive) cover the cases. Anything more complex creates a fresh decision problem at every triage window.
Frequently asked questions
What does Inbox Zero actually mean?
In Merlin Mann's original 2007 framing, "zero" refers to zero time spent thinking about email when you are not processing it, not zero messages in the inbox. Mann himself was clear: "It is not how many messages are in your inbox; it is how much of your own brain is in that inbox." The literal empty-inbox interpretation is the misread that has dominated since.
What are the 5 D's of Inbox Zero?
Delete, Delegate, Respond, Defer, Do. Some sources collapse to four by merging Respond into Do, but Mann's original method is five distinct actions, each with a different default outcome. The 5 D's table above shows when each applies and the typical mistake to avoid.
Is Inbox Zero realistic in 2026?
For most knowledge workers, the literal empty inbox at end-of-day is unrealistic and usually counterproductive. The original method (zero attention spent on email between processing windows) is realistic, with adaptations: batched windows instead of constant attention, filters for low-decision email, and moving same-team conversations off email entirely.
How long should it take to reach Inbox Zero?
Two batched windows totaling 30 to 45 minutes per day is enough for most roles. Client-facing and management roles often need three or four shorter windows. The first week takes longer because the back-catalog is cleared; after roughly two weeks the steady-state cadence settles in.
How do you do Inbox Zero in Gmail?
Gmail's Multiple Inboxes layout works well: one section for unread, one for Snoozed (Defer), and Archive as the default action. Turn off all desktop and mobile notifications; rely on the two-window cadence instead. Filters route newsletters and app digests to a Read Later label that you check once a week.
How do you do Inbox Zero in Outlook?
Use Focused Inbox to surface what matters; route the rest to Other and triage less frequently. Snooze for Defer. Quick Steps for one-click delegate-and-archive on common patterns. The principles are the same as Gmail; only the buttons move.
Should small teams use Inbox Zero?
Yes, but with one extra move: examine which conversations should not be in email at all. Same-team coordination, project status, and quick questions usually belong in chat or a shared workspace, not in seven separate inboxes. The biggest Inbox Zero gain for teams is upstream: less email volume, not better email triage.
How to start this week
Pick two windows tomorrow. Block them on the calendar; treat them as appointments. Outside those windows, the email tab stays closed and notifications stay off. The first day will feel uncomfortable; by the third day the rhythm is doing the work.
If the triage simulator above showed a clear drift in your decisions, run it again at the end of the week. The categories sharpen with about 50 deliberate decisions, not with reading more about the method.
The fastest path to Inbox Zero is not better triage; it is fewer conversations in email. Rock combines chat, tasks, and notes in one workspace. One flat price, unlimited users. Get started for free.
Context switching is the small, constant act of stopping one task to start another. A Slack ping pulls you out of a draft. A calendar reminder cuts a coding session in half. A teammate drops a quick question that takes ninety seconds to answer and twenty minutes to recover from.
The cost is not in the ninety seconds. It is in the recovery, multiplied across a day, a week, a quarter. This guide pulls together what six pieces of research actually say about the cost of context switching at work. It separates context switching from multitasking, a common confusion that leads to the wrong fix. And it lays out four structural changes that reduce switching without pretending coordination is optional.
Quick answer: what context switching costs
Context switching is the act of stopping a task to begin another. The cost shows up in the time and cognitive effort it takes to refocus, which research from UC Irvine puts at up to 23 minutes per switch. Across a typical workday with 8 to 10 unwanted interruptions, that is roughly two hours of refocus tax, in addition to the time spent on the interrupting task itself.
The number is an upper-bound average across knowledge workers. Routine tasks recover faster; deep cognitive work recovers slower. What matters for most teams is not the exact figure but the structure. Each switch carries a non-trivial recovery cost. The costs accumulate non-linearly across a day. And the source of most unforced switches is the team's tools and norms, not the individual's discipline.
Context Switching Cost
Estimate what tool-toggling and interruptions cost a single person each year. Defaults are calibrated to peer-reviewed averages; override to match your own day.
Your inputs
Estimated cost
Math is honest, not magic. Want fewer switches by design? Try Rock free.
The calculator above uses peer-reviewed defaults. Override the inputs to match your own day; what comes out is a directionally honest number, not a precise one.
Context switching vs multitasking
The two get used interchangeably and they should not. The fix for one is not the fix for the other.
Aspect
Multitasking
Context switching
Definition
Doing two cognitively demanding tasks in parallel
Stopping one task to start another, repeatedly
What the brain does
Rapidly toggles attention; the experience of "parallel" is illusion
Reloads the mental context of the new task; the old task leaves residue
Cognitive load
High; each task gets fragmented attention
High at the moment of switch; lower between switches
Common trigger
Listening to a meeting while writing email
Slack ping mid-task pulls you to a thread
Honest fix
Single-task one of the two; defer the other
Reduce trigger frequency or batch similar work
Most popular advice ignores the distinction and prescribes the same remedy for both. That is why "just stop multitasking" rarely lands when the actual problem is a chat tool that pulls you out of work eight times an hour. The remedy for that pattern is reducing how often the trigger fires, not trying harder to ignore it.
"People need to stop thinking about one task in order to fully transition their attention and perform well on another. Yet, results indicate it is difficult for people to transition their attention away from an unfinished task." - Sophie Leroy, University of Washington Bothell, in Why is it so hard to do my work?
Leroy's framing is what makes the practical case for batching. A quick reply to a Slack message during deep work feels almost free. The actual cost is the next 5 to 15 minutes of degraded focus on the task you returned to. The ping is small. The residue is not.
What 6 studies actually show
The research base is older and broader than most productivity blogs let on. Six findings worth knowing, in rough chronological order.
UC Irvine, 2005. Gloria Mark's first major CHI paper tracked information workers across multiple firms. They switched activities every 3 minutes on average, and almost never spent more than five uninterrupted minutes on a single task before something pulled them out.
APA review, 2006. The American Psychological Association's research summary on task switching aggregated experimental work and found that switch costs can reduce productivity by up to 40%. The summary covers multitasking and switching together, but the underlying experiments isolated each.
UC Irvine, 2008. Mark's follow-up paper measured how long it took to fully return to an interrupted task: 23 minutes 15 seconds on average. This is the upper-bound number behind the calculator above and the figure most-cited in the literature.
Leroy, 2009. The attention residue paper covered above. Peer-reviewed, the cleanest mechanistic explanation of why switches cost more than the time of the interruption itself.
Harvard Business Review, 2022. Rohrbach and team analyzed 122,000 application-switching events from a Microsoft research dataset. They found knowledge workers switch between apps and websites nearly 1,200 times per day, costing about 4 hours per week in reorientation alone.
Microsoft Work Trend Index, 2023. The 2023 report surveyed 31,000 workers across 31 countries. Nearly 2 in 3 people struggle with the time and energy to do their work, citing tool sprawl and chat volume as primary culprits. The pattern is consistent across geographies, including high-growth markets in SEA and Latam.
"To produce at your peak level you need to work for extended periods with full concentration on a single task free from distraction." - Cal Newport, in Deep Work (Grand Central Publishing, 2016)
Why remote and hybrid work make it worse
The Microsoft data is consistent with a smaller pattern most managers see anecdotally: remote and hybrid workers face more digital interruptions per day than in-office equivalents. The reason is mechanical, not motivational. In-office, a casual question is a 30-second hallway exchange or a quick desk visit. The same question over chat becomes a typed message that interrupts whatever the recipient is doing, sits in their notifications, and waits.
Two patterns make this acute. First, businesses with clients across time zones layer client chat over team chat, doubling the trigger surface. A designer working on three retainers can have three client Slacks, three internal channels, and an email account all live in the same hour.
Second, account and project managers spend most of their day on coordination. Switching between people, tools, and contexts is the job. Their floor for unforced interruptions is much higher than a developer's, and pretending otherwise creates fake productivity advice that does not survive contact with the role.
The fix is not returning to the office. It is treating asynchronous chat the way good teams already treat email. Threaded, batched, with response windows that are measured in hours, not seconds, for everything except genuine emergencies.
Remote and hybrid teams face more digital interruptions per day; chat replaces hallway conversations and the trigger surface widens.
Need a workspace to run the framework?
Rock pairs task boards with chat so projects stay in one place.
Most articles list nine or ten. Honest experience says four moves carry most of the weight. The rest are variants or refinements once the structural changes have stuck.
Audit your switches for one workdayKeep a sticky note open. Every time something pulls you out of the task you were on, mark it: notification, meeting, person walking up, a thought of your own. Most teams overestimate external triggers and underestimate self-interruptions. The honest count tells you which fix to start with.
Cut the loudest source firstIf notifications dominated the tally, turn them off everywhere except direct messages and pick two daily windows to check chat. If meetings dominated, decline or shorten the recurring ones with the lowest output. Do not try to fix all sources in week one; one cut, sustained for two weeks, beats five cuts that revert by Friday.
Protect one block per day, then twoStart with a single 90-minute morning block on the calendar, marked busy. After two weeks of holding it, add a second block in the afternoon. Resist scaling up faster; the first block is doing the work even when it feels small, because the rest of the day reorganizes around it.
Batch chat the way good teams batch emailThree chat checks per day, not constant attention. The norm shifts when leaders model it: a manager who replies in 8 minutes during their batch window, not 8 seconds during deep work, gives the team permission to do the same. Async-first chat tools make this easier; constant-attention tools fight it.
Review the audit after two weeksRe-run the same one-day audit. The counts should be lower in the categories you targeted; if not, the fix is not actually being held. Repeat with the next-loudest source. The point is not zero switches; it is reducing the unforced ones while keeping the productive coordination intact.
The order matters. Audit first, because most teams misdiagnose the dominant source. Cut the loudest before adding the smaller ones, because compound fixes rarely hold. Protect one block before two, because a single defended hour reorganizes the rest of the day in ways an unprotected calendar never will. And review honestly, because intent and reality drift fast in a busy week.
What we recommend
The personal-discipline answer to context switching is the Pomodoro Technique: short focused intervals, structured breaks, an interruption record. Pairing it with the eat the frog method, which front-loads your hardest task into the first protected block of the day, means those intervals go toward what matters most. It works at the level of one person managing their own attention.
The team-level answer is structural. The single biggest unforced source of switching for most knowledge teams is chat that demands constant attention. Pile three or four other tools on top, each pinging for the same notifications, and the cost of context switching compounds. The fix is fewer tools, async-first norms, and clear ownership so people know what to work on without asking.
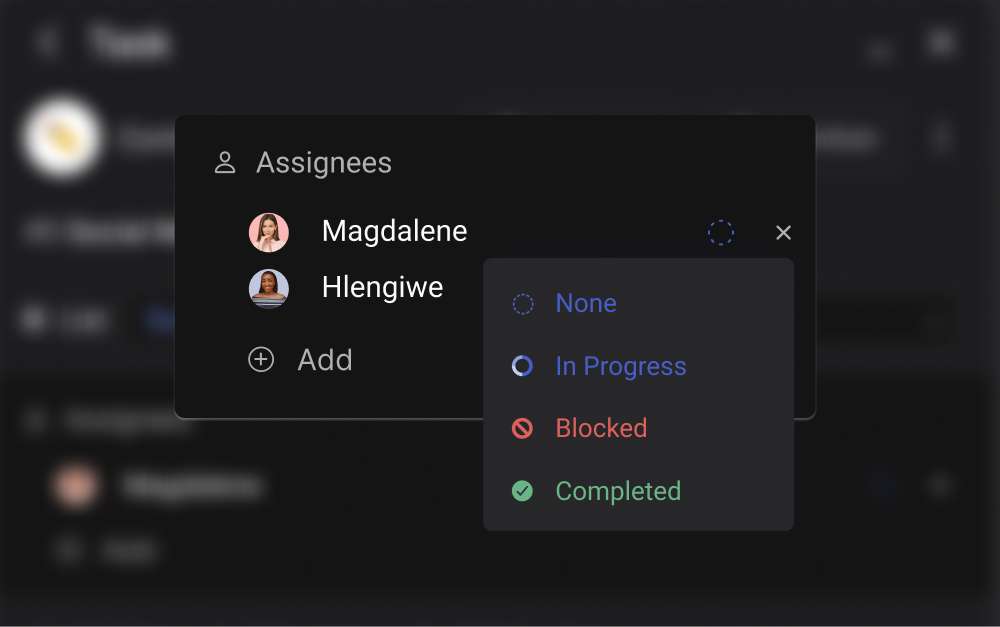
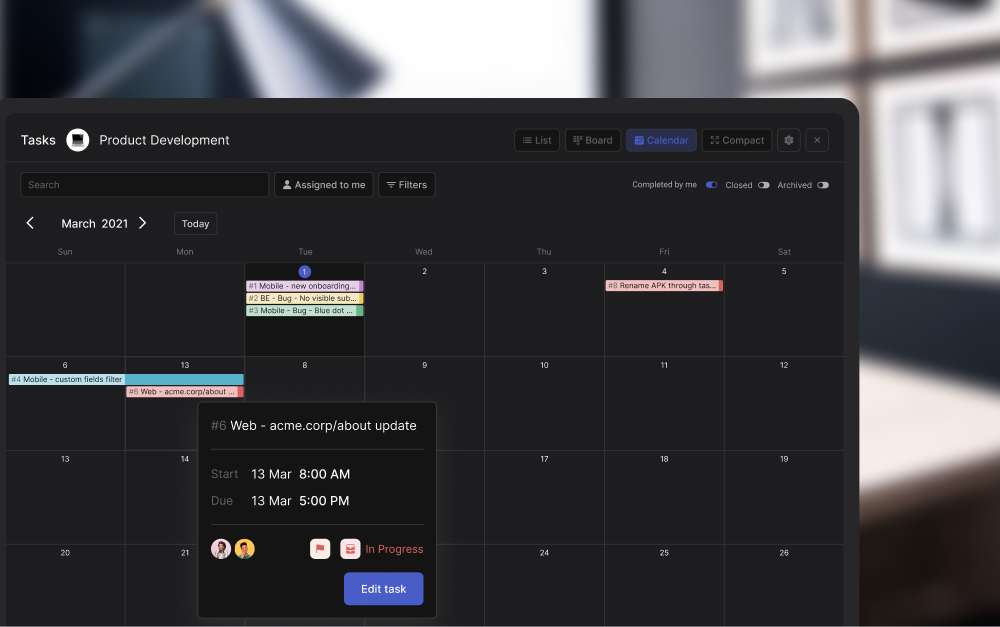
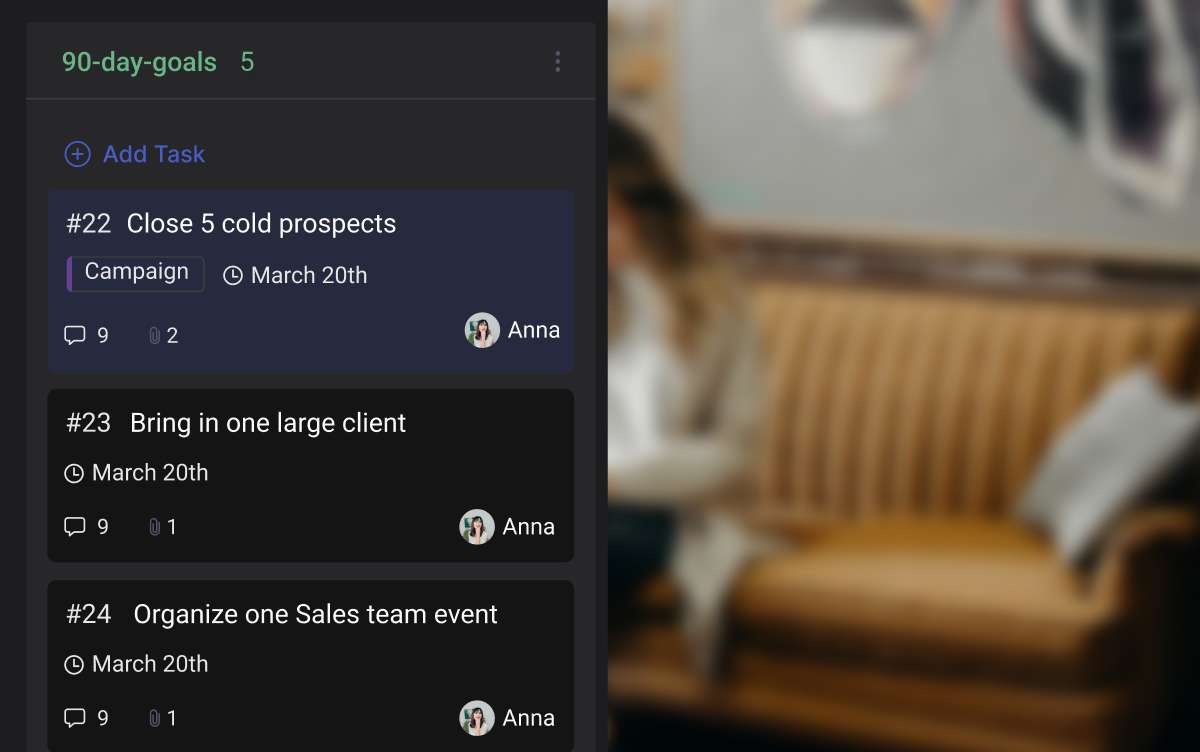
What we do at Rock: chat, tasks, and notes live in the same workspace, so the work and the conversation about the work do not require switching apps. Tasks have explicit owners and per-person status, so coordination questions get answered by reading the board instead of pinging the person.
Topics let conversations branch from one main chat without spawning a new channel for every thread. Set Aside lets a teammate flag your message for later instead of forcing you to answer in real time. Less switching by design, not because the team has more willpower than yesterday.
Topics let conversations branch from one main chat without spawning a new channel for every thread, reducing the surface that triggers switches.
Common pitfalls
The most predictable failure modes when teams try to reduce context switching.
Treating switching as a willpower problem"Just stop checking Slack" rarely works because the pings are not a discipline failure. They are a system that rewards immediate response. Reduce the number of triggers (notifications off, fewer tools open, batched chat checks) before pretending more willpower will close the gap.
Confusing context switching with multitaskingThe two need different fixes. Multitasking (writing email during a meeting) is solved by single-tasking. Context switching (Slack ping mid-task) is solved by reducing trigger frequency. Articles that lump them together usually prescribe the wrong remedy for the wrong problem.
Banning all interruptionsSome interruptions are the work. A client-facing role with a four-hour quiet block is a client-facing role on its way to losing the client. The realistic target is reducing unforced switches caused by tool sprawl and notification overload, not pretending coordination is optional.
Adding more tools to fix tool sprawlA focus app, a meeting blocker, a calendar plugin, a notification manager. Stacking productivity tools on top of an interruption-heavy stack usually makes the switching problem worse. Consolidation beats addition: fewer apps where work happens, not more apps that try to manage them.
Measuring focus time without measuring outputLogged hours of "deep work" mean nothing if the deliverables do not move. The check that matters is finished work per week, not minutes recorded as focused. A team can spend more time in protected blocks and produce less if those blocks are filled with the wrong tasks.
"Continuous partial attention is the always-on, anywhere, anytime, any-place behavior that involves an artificial sense of constant crisis. It is motivated by a desire not to miss anything." - Linda Stone, former executive at Apple and Microsoft, who coined the term in 1998
Frequently asked questions
How much does context switching actually cost?
The most cited number is 23 minutes 15 seconds to fully refocus after an interruption (Mark, UC Irvine, 2008). Translated to a normal day with 8 to 10 unwanted interruptions, that is roughly two hours of refocus tax. Your real number depends on the work itself: deep coding or writing pays more, routine email less.
Is context switching the same as multitasking?
No. Multitasking is trying to do two cognitively demanding tasks in parallel, which research shows is mostly an illusion of speed. Context switching is sequential: you stop one task and start another. Both are costly, but the fix is different. Multitasking is fixed by single-tasking; context switching is fixed by reducing how often the trigger fires.
What is attention residue?
A 2009 paper by Sophie Leroy showed that part of your attention stays on the previous task even after you switch. The carry-over is biggest when the prior task was unfinished or recent. This is why a quick Slack reply during deep work feels almost free but actually costs the next 5 to 15 minutes of focus.
How long does it take to refocus after an interruption?
Mark and Iqbal found 23 minutes 15 seconds on average across knowledge workers. Shorter for routine work, longer for deep cognitive tasks. The number is the upper end of a wide range; what matters is that the cost is non-trivial and accumulates with each switch.
Can context switching ever be avoided completely?
No, and chasing zero is the wrong goal. Some switching is the work itself: a project manager juggling three deliverables, an account manager answering client questions. The realistic target is reducing unforced switches caused by notifications, tool sprawl, and unclear priorities, while keeping the productive switching that real coordination requires.
Does remote work make context switching worse?
In most studies, yes. Microsoft Work Trend Index data shows remote and hybrid workers face more digital interruptions per day than in-office equivalents, mainly because chat and email replace hallway conversations and impromptu desk visits. The fix is not returning to the office; it is treating async chat the way good teams treat email, with batched checks instead of constant attention.
How to start this week
Pick the audit. One workday, one sticky note, every time you switch tasks make a tally mark and label the source. The number will be larger than you expect; the dominant source will surprise at least one person on the team. Cut that one. Hold the change for two weeks before adding a second move.
If a calculator output above looked unexpectedly bad, the path forward is not a productivity app and not more willpower. It is the boring, structural work of reducing how often the trigger fires. The research on the cost of context switching is consistent that this is what moves the number. Everything else is at the margin.
Want fewer switches by design? Rock combines chat, tasks, and notes in one workspace. One flat price, unlimited users. Get started for free.
The Pomodoro Technique is a 25-minute focus method invented by Francesco Cirillo as a university student in the late 1980s, named after the tomato-shaped kitchen timer he used. The method is a simple loop: pick a task, work for 25 minutes, take a 5-minute break, repeat. After four cycles, take a longer break. The popularity of the method comes from how easy it is to start; the durability comes from a small body of research that explains why short focused intervals beat continuous attempted concentration.
This guide covers what the Pomodoro Technique is and how to do it. It walks through the research on why 25 minutes works and when the interval is the wrong fit (deep work, ADHD, developers). The closing sections compare Pomodoro with Flowtime and Deep Work, and cover how small teams can run synchronized Pomodoros.
What the Pomodoro Technique is
The Pomodoro Technique is a time-management method that breaks focused work into 25-minute intervals (called Pomodoros) separated by 5-minute breaks, with a longer 15 to 30-minute break after every fourth interval. The method's three rules are simple. A Pomodoro is indivisible: if it gets interrupted, it does not count. Each Pomodoro is dedicated to a single task. The break is mandatory.
The technique is not a productivity tool. It is a discipline against context switching. The 25-minute timer is the smallest commitment most people can make to single-tasking; the break is the smallest interruption that lets the brain reset before the next interval. Skip either piece and the method stops working.
"The appearance of so many internal interruptions is our mind's way of sending us a message: We are not at ease with what we are doing." - Francesco Cirillo, creator of the technique (francescocirillo.com)
Cirillo's frame is the right test for whether the method is helping. If you reach the end of a Pomodoro and the urge to check email or switch tasks was constant, the technique is doing its diagnostic job: it is making your distractions visible. The cure is not more willpower; it is examining what the interruptions tell you about the work itself.
Try one yourself. The timer below rolls through 4 Pomodoros (25-minute focus + 5-minute break) and gives you a long break after the fourth interval.
Focus
Pomodoro 1 of 4
25:00
Tracks just this session. Want chat that does not interrupt your Pomodoros? Try Rock free.
Why this still matters in 2026. AI assistants speed up the work, but they also add a constant stream of suggestions and tabs to chase. Protected focus blocks are one of the few things that hold up against that. The Pomodoro is less about the timer and more about deciding, for 25 minutes, what you will not touch.
How to do a Pomodoro: the 6 steps
The full method is six steps. The first time through it feels mechanical; by the third or fourth Pomodoro the rhythm becomes natural and the timer fades into the background.
Pick one taskChoose a single task you want to work on. Not three; one. The technique falls apart when you try to switch contexts mid-session, which is the whole point: Pomodoro is a single-tasking discipline disguised as a timer.
Set the timer to 25 minutesA kitchen timer, a phone timer, or a dedicated app. The mechanical timer Cirillo originally used is shaped like a tomato, which is where the name comes from. Twenty-five minutes is the canonical interval; later sections cover when other intervals fit better.
Work on the task until the timer ringsNo email, no Slack, no quick checks. If a thought about something else surfaces, write it on a piece of paper and return to the task. The interruption record is part of the method, not an optional add-on; reviewing it later shows you what is actually pulling your attention.
Mark the Pomodoro as completeA checkmark on paper, a tally in a notebook, or a tick in your task tool. Cirillo uses Xs. The act of marking is small and feels silly, but it builds the visible record of finished sessions that turns Pomodoro from a timer into a tracking system.
Take a 5-minute breakStand up, walk away, look out the window, get water. The break is not optional and not for checking email. The brain needs the disengagement to consolidate; skip the break and the next Pomodoro starts with cognitive residue from the last one.
After 4 Pomodoros, take a longer break15 to 30 minutes, away from the screen. The longer break is where the method's research-backed benefits show up most clearly: a recovery interval after roughly two hours of focused work prevents the fatigue accumulation that otherwise compounds across the day.
The interruption record (step 3) is the part most people skip and the part that produces the most useful insight after a few weeks. Patterns emerge: which apps pull you out, which kinds of thoughts intrude, which times of day are your worst for focus. The Pomodoro is the timer; the record is the diagnostic.
Why 25 minutes works (the research)
The case for short focused intervals is partly research, partly clinical observation, and partly the practical reality that most knowledge workers cannot maintain peak concentration for hours. Three pieces of research explain the underlying mechanics.
Three lines of research explain why the 25-minute interval works: attention residue, multitasking cost, and recent meta-analytic evidence.
Attention residue. Sophie Leroy's 2009 University of Washington research introduced the concept of attention residue. When you switch from one task to another, part of your attention stays on the prior task and degrades performance on the new one. The residue is worse when the prior task is unfinished. The Pomodoro Technique creates clean breakpoints by completing a focused interval before switching, which reduces the residue cost compared to switching mid-task.
The cost of multitasking. Ophir, Nass, and Wagner's 2009 study in the Proceedings of the National Academy of Sciences found that heavy media multitaskers performed worse than light multitaskers on tests of filtering, working memory, and task-switching ability. The finding flipped the conventional wisdom: multitasking does not build the muscle for handling multiple streams; it weakens it. Pomodoro is a structural defense against the multitasking habit.
Recent meta-analytic evidence. A 2025 BMC Medical Education scoping review of 32 studies (combined N around 5,270) found Pomodoro use correlated with stronger focus (r=0.72), higher performance (r=0.65), and lower fatigue (r=−0.55). The effect sizes are large by social-science standards. Most of the studies are on students, not professionals; the magnitude still suggests the method does measurable work, not just psychological reassurance.
"Few can maintain peak cognitive intensity for more than an hour or so without some sort of relief." - Cal Newport, author of Deep Work (calnewport.com)
Newport's frame is what makes the break non-negotiable. The 5-minute interval is not a reward for finishing a Pomodoro; it is the recovery the next Pomodoro needs to land. Skip the breaks and the third or fourth interval delivers worse focus than the first.
When the 25-minute Pomodoro doesn't work
The 25-minute interval is canonical, not universal. Three patterns of work resist the standard timer, and forcing them into the rhythm produces worse output than abandoning the technique.
Deep work and creative drafting. Newport's deep work research argues that some cognitive tasks (writing, complex analysis, debugging hard problems) need 60 to 90 minutes minimum to reach peak intensity. The 25-minute timer cuts the warm-up off mid-stride. For deep work, longer blocks (60 minutes plus a 15-minute break, or 90 minutes plus 30) fit the cognitive demand better. Use the Pomodoro pattern as scaffolding, but stretch the intervals.
Developer flow. Programmers report that 25 minutes is too short for context-heavy work. A common adaptation is the 50/10 split: 50 minutes of focused coding, 10 minutes of break, repeated until natural lunch or end-of-day boundaries. The longer interval lets context build; the doubled break lets it clear before the next session.
Mid-flow timer rings. Even in canonical Pomodoro work, a timer that rings while you are clearly mid-thought does more harm than good. Cirillo's own guidance allows 5 to 10 extra minutes to finish the immediate thought; the rule is do not start a new sub-task during that time. The rule is not "stop typing whatever happens." The rule is "do not switch contexts."
Pomodoro for ADHD and neurodivergent users
Pomodoro is one of the most-recommended productivity techniques for adults with ADHD, and also one of the most commonly modified. The standard 25-minute interval works well for some neurodivergent users and badly for others; the difference depends on how the brain handles initiation friction and hyperfocus.
For initiation difficulty (most common ADHD focus issue). The 25-minute timer can be too long. A 10 or 15-minute starter Pomodoro creates a smaller commitment that the prefrontal cortex is more willing to make. Once the first short interval is complete, the threshold to extend into a normal 25-minute session drops. Some ADHD coaches recommend chaining 10/3, 15/5, then 25/5 intervals across a session as the day's executive-function capacity warms up.
For hyperfocus risk. Some ADHD users get into a focused state and stay there for hours, missing meals, breaks, and meetings. For this pattern the timer is more important than the interval; longer intervals (45/10) with a non-snoozable alarm work better than rigid 25/5 because the alarm becomes the reset signal the brain otherwise does not provide.
Interruption record as accommodation. The interruption-record step has particular value for neurodivergent users. Writing down the intrusive thought lets the brain release it without the executive function cost of suppression. Multiple ADHD coaches treat the record as the most important step of the method, more so than the timer.
"The mark of a person who is in control of consciousness is the ability to focus attention at will, to be oblivious to distractions, to concentrate for as long as it takes to achieve a goal, and not longer." - Mihaly Csikszentmihalyi, Flow
Csikszentmihalyi's frame is the right calibration. Focus is not a virtue measured in minutes; it is the discipline of choosing where attention goes and for how long. Pomodoro at any interval length is a tool for that discipline; the standard 25-minute version is the most common, not the only valid one.
Pomodoro vs other time-boxing methods
Pomodoro is one of several time-boxing methods. Each fits a different work pattern; teams that pick a single method dogmatically tend to underperform teams that switch methods based on the work in front of them.
Method
Interval
Best for
Watch out for
Pomodoro
25 min work, 5 min break, long break after 4
Procrastination, single-tasking, learning new material, admin work
Too short for creative work that needs warm-up; rigid timer can break flow
Flowtime
Work until you choose to stop, then break for half the session
Creative work, deep problem-solving, anyone who finds Pomodoro restrictive
Easy to slip into long sessions without breaks; needs self-discipline
Deep Work blocks
60-90 min minimum, longer for true depth
Senior-level cognitive work, writing, strategic analysis, coding hard problems
Hard to schedule with meetings; modern roles rarely allow uninterrupted blocks
52/17
52 min work, 17 min break (DeskTime data)
Office workers with predictable cadence; mid-difficulty knowledge work
Not based on rigorous research; just one company's productivity-app data
Timeboxing
Fixed time block per task on a calendar (variable length)
Multi-project days, planning ahead, accountability against estimates
Overrunning a box derails the whole day; needs honest estimation
Time blocking
Group similar tasks into themed blocks (deep work block, shallow block)
Reducing context-switching across many small tasks
Calendars rarely match reality; meetings break themed blocks
The honest read: Pomodoro is the right default for procrastination, single-tasking discipline, and admin work. Flowtime fits creative work and deep problem-solving. Deep Work blocks fit senior cognitive output. The point is not picking one method and forcing all work into it; the point is matching the method to the work and switching when the work changes.
What we recommend (Pomodoro for small teams)
Most Pomodoro writing assumes a single focused individual. Small teams can run a synchronized Pomodoro pattern that adds two structural benefits: shared focus blocks (everyone working heads-down at the same time) and predictable communication windows (questions land at the break, not mid-Pomodoro).
Synchronized Pomodoros add two structural benefits: shared focus blocks and predictable communication windows.
The basic protocol is three rules. First, the team agrees on synchronized Pomodoro blocks (for example, 9:30 to 11:30, four Pomodoros with breaks between). Second, during a Pomodoro, do-not-disturb is the default: messages get queued, not pinged. Third, the breaks are when async questions get answered, quick questions get raised, and handoffs happen.
The technique pairs naturally with how agile teams already work in sprints. Sprints are the team-level cycle (1 to 4 weeks); Pomodoros are the individual-level interval inside the day. Both use timeboxing as the core discipline, just at different scales. Eisenhower and MoSCoW handle prioritization upstream; Pomodoro handles execution discipline downstream of those decisions.
Common pitfalls
The mistakes below show up across teams and individuals who try Pomodoro and quietly drop it after two weeks. Most are pattern-recognition failures, not analytical ones.
Forcing 25 minutes onto creative workDrafting, designing, and deep problem-solving often need 30 to 60 minutes of warm-up before the work starts to land. Forcing the 25-minute timer breaks the warm-up and the timer becomes the cognitive interruption it was supposed to prevent. For creative work, Flowtime or longer Deep Work blocks usually fit better.
Breaking flow when the timer ringsIf the work is genuinely flowing, finishing the thought is not cheating. The Pomodoro is a discipline against procrastination, not a discipline against momentum. Cirillo's own guidance allows for 5 to 10 extra minutes when you are mid-sentence; the rule is do not start a new sub-task in that time.
Treating the timer as productivity theaterSessions logged, breaks taken, screenshot posted to social. Looking productive is not the same as being productive. The check that matters is whether the marked Pomodoros are producing finished work; if the tally goes up but the project does not progress, the timer is the prop, not the practice.
Skipping the long breakAfter four Pomodoros, the 15 to 30-minute long break is where most of the fatigue-prevention benefit lives. Skipping it lets cognitive residue accumulate across the morning and the next session quality drops noticeably. The break is not the reward for working; it is part of the work.
Ignoring the interruption recordThe point of writing down distractions during a Pomodoro is the review afterward, not the act of writing. Most teams skip the review and lose the diagnostic value. Look at the interruption log weekly and patterns emerge: which thoughts intrude most often, which apps pull you out, which times of day are worst for focus.
The biggest of the five is the third one. Treating the timer as productivity theater is how a discipline against context switching becomes a way of looking busy. The check that matters: are the marked Pomodoros producing finished work? If the tally goes up but the project does not progress, the timer is the prop, not the practice.
How to start using Pomodoro this week
If you have never used Pomodoro, do not try to convert your whole workflow on day one. Pick one task that you procrastinate on and run two or three Pomodoros against it. The honest test: did you finish more in those 60 to 75 minutes than you usually finish in the same window? If yes, expand the practice. If not, the method is not the constraint; the underlying task or motivation is, and a timer cannot fix it.
Three moves to start this week. Use the timer at the top of this page, a dedicated Pomodoro app, or a kitchen clock; the tool is irrelevant. Run a single 25-minute interval on a task you have been avoiding, with phone face-down and notifications off. Take the break. Decide whether the next Pomodoro is the same task or a different one. The discipline compounds from there.
Run focus blocks alongside the team. Rock combines chat, tasks, and notes in one workspace where do-not-disturb conventions and shared status keep Pomodoros from being interrupted. One flat price, unlimited users. Get started for free.
Most agencies have a brand book and a creative brief template. Somehow the work still drifts: campaigns feel disconnected from the brand, briefs get rewritten three times before production, and nobody can quite explain what the campaign is supposed to make the audience believe. The missing layer between the brand and the brief is the creative strategy.
This guide is for marketers and agency leads building a creative strategy. (If you are researching the creative strategist role, this is the wrong page; we cover the document and the process, not the job.) The guide covers what creative strategy is and how it differs from the brand strategy, the creative brief, and content strategy. It walks through the six-step process, the one-page strategy statement, three worked examples, and the common pitfalls.
The missing layer between the brand book and the creative brief is the creative strategy.
What creative strategy actually is
A creative strategy is the document and the discipline that connects a brand strategy to the creative work the team produces against it. It names six things: the audience, the insight that explains why they will care, the message they should walk away believing, the big idea that carries it, the channels that earn it, and the metric that proves it worked. The creative strategy is the layer between brand strategy (slow, abstract, multi-year) and the creative brief (fast, concrete, per project).
The four layers below are easy to confuse, and most teams confuse at least two. The clearer the line between them, the cleaner the work that comes out the other end.
Layer
Question it answers
Output
Time horizon
Brand strategy
Why does this brand exist and how does it win?
Positioning, mission, value proposition, brand architecture
3 to 5 years
Creative strategy
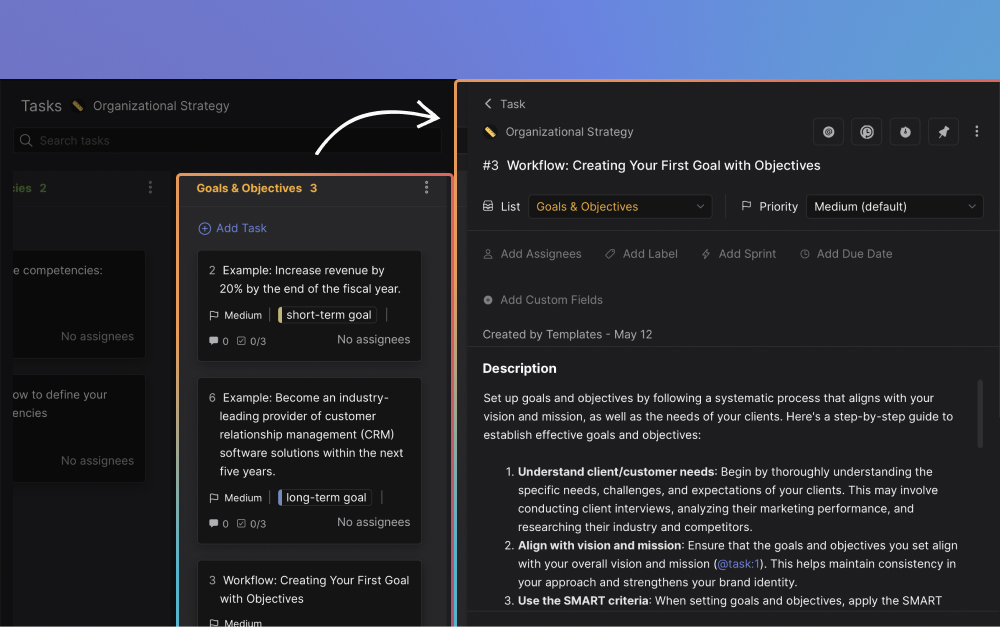
What is the big idea that connects this brand to this audience right now?
How does the brand consistently produce content across channels?
Pillars, editorial calendar, format mix, distribution plan
Annual, refreshed quarterly
"Strategy is an informed opinion about how to win. Information without an opinion is not useful." - Mark Pollard, brand strategist (markpollard.net)
Pollard's frame is the right test for whether a creative strategy has earned its name. A document that lists what the audience is interested in, what competitors are doing, and what the brand stands for is a research summary. A document that takes a position on what the audience should walk away believing, and why this brand is the one to deliver it, is a strategy.
Why agencies need a written creative strategy
The case for writing it down is alignment. Every brief that comes after inherits from the strategy; every revision conversation has the strategy as the reference document. Teams that skip the writing step end up arguing about whether the work is on-brand without a shared definition of what on-brand means for this campaign.
The data argues for taking it seriously. Nielsen's analysis of around 500 CPG advertising campaigns found that creative quality accounts for 47 percent of sales lift, more than any other variable, including media spend, brand reputation, or targeting. Not the budget, not the channel mix, not the targeting model. The creative.
The process below is what most agencies learn the hard way. The steps are sequential because each step is the input to the next. Skip step two (insight) and the message in step three has nothing to stand on. Pick channels (step four) before the audience and the strategy is a tactic in disguise.
Sequential steps; each step is the input to the next.
Define the business objectiveStart with the number that matters. New customer acquisition? Win-back? Premium positioning push? The creative strategy is downstream of a business goal. If you cannot name the goal in one sentence, the strategy will produce activity, not movement. The goal also sets the success metric that comes back at step five.
Find the audience insightInsight is not data. Data tells you what; insight tells you why. The audience insight is the thing the audience knows about themselves but rarely says out loud. Get there through interviews, support tickets, sales calls, and Reddit threads. Generic insights ("they want value") produce generic creative; sharp ones ("they are exhausted by feeling judged at the gym") produce work that lands.
Build the core message and big ideaThe message is what the audience should walk away believing. The big idea is the single creative thought that carries the message. Plans that stop at the message ship taglines; plans that earn the big idea ship campaigns. The test: a junior writer should be able to brief their next ten executions from the big idea without asking what to do.
Choose the channels and formatsMost creative strategies pick channels at the end and add them to a list. The team that compounds picks them as a strategic choice: where will this audience encounter this message in a state where they care? A B2B insight expressed on TikTok is wasted; a DTC insight buried in LinkedIn thought leadership is wasted. Choose the channels that match the audience moment.
Set the success metricTie back to the business goal from step one. The success metric for an awareness play is reach plus brand search lift; for a conversion play it is qualified leads or sales. The metric should be a small number of leading indicators plus the lagging business outcome. Strategies without a defined metric become permanent because nothing tells the team to stop.
Set the review cadenceQuarterly review of the strategy is the right rhythm for most agencies. The review asks two questions: did the work deliver against the metric, and is the insight still true? An insight that worked twelve months ago may have aged out as the category shifted. The review is also the natural moment to update the brief templates that inherit from this strategy.
The biggest of the six is step two: the audience insight. Every other step rests on it. Campaigns built on a sharp insight have a center of gravity; campaigns built without one feel like a deck of disconnected assets even when the production quality is high.
The one-page creative strategy statement
The strategy lives as a one-page document the team re-reads every quarter. The format below is the minimum useful version. Some agencies expand it with a competitive snapshot, a tone-of-voice section, or a do-not-do list; the seven-row core is what every brief inherits from.
The seven-row strategy statement is the document every brief inherits from.
Field
Worked example: B2B HR-tech challenger
Business objective
Lift qualified-lead volume by 40 percent in three quarters; defend share of voice against two larger incumbents
Audience
Heads of People at 200 to 1,000-employee SaaS firms, sized out of legacy HRIS, willing to consider a smaller vendor for better support
Insight
Buyers feel they are paying for size and getting ignored by it; they want a partner, not a platform
Core message
The bigger HR vendors stopped picking up the phone. We answer.
Big idea
"Real Support" campaign: every asset ends with a real team member's photo, name, and direct line; never a chatbot, never a queue
Channel logic
Founder-led LinkedIn thought leadership for awareness; comparison-page SEO for consideration; case-study video plus direct sales outreach for decision
Success metric
Qualified-lead volume month-over-month (leading); branded search uplift (lagging); 40 percent lift target by Q3 with mid-quarter checkpoints
What this is NOT
Not feature messaging, not enterprise positioning, not a price-led play; we will lose deals to "biggest vendor" buyers and that is fine
The "What this is NOT" row is the most under-used. Naming what the strategy explicitly does not chase is what gives the team permission to lose the wrong battles. Without it, every revision conversation reopens the scope. With it, the conversation has somewhere to land. Once the strategy is written, the creative brief picks up where it ends, translating the strategy into deliverables.
Three creative strategy examples
Examples are easier to recognize than to reverse-engineer. The three below are short summaries; the actual strategy documents behind them ran to several pages each. The point is to illustrate the shape of an insight, a message, and a big idea that fit together.
Dove "Real Beauty" (Ogilvy, 2004 onward). Audience: women aged 25 to 54 in markets where beauty advertising was overwhelmingly young and Photoshopped. Insight: a vanishingly small percentage of women considered themselves beautiful, and the industry was part of the cause. Message: beauty is more than the narrow image the industry sells. Big idea: photograph real women, no retouching, no models, in everyday contexts. Channels: outdoor, print, video. Success metric: brand love, market share, brand search. The strategy ran for two decades because the insight stayed true.
Volkswagen "Think Small" (DDB, 1959). Audience: postwar American buyers conditioned to want big, chrome-heavy cars. Insight: the audience was beginning to suspect that bigger was not actually better. Message: small is honest, efficient, and self-aware. Big idea: tiny VW Beetle in vast white space, deadpan copy that admitted the car's limitations. Channels: print, retail. Success metric: sales lift on a vehicle that, on paper, should not have sold in America. The strategy worked because it sided with a feeling the audience had not quite named yet.
B2B services example: a small HR-tech challenger. Audience: heads of People at 200 to 1,000-employee SaaS firms, sized out of legacy HRIS. Insight: buyers feel they pay for size and get ignored by it. Message: the bigger HR vendors stopped picking up the phone; we answer. Big idea: every asset ends with a real team member's photo, name, and direct line. Channels: founder-led LinkedIn, comparison-page SEO, case-study video. Success metric: qualified-lead volume and branded search. Smaller scale than the brand examples; same anatomy.
"A strategist's job is to make meaning out of messiness." - Bonnie Wan, head of brand strategy, Goodby Silverstein & Partners
Wan's frame is the right test for examples like Dove and Volkswagen. The audience reality the strategy responded to was always there; the strategist's job was to find the cleanest expression of it. The same applies at small scale. The HR-tech challenger above did not invent the truth that buyers feel ignored by big vendors; the strategy was finding the cleanest way to act on it.
What we recommend
At Rock we run creative strategy as a living document inside the team workspace. The strategy lives as a pinned note in the marketing or client space. Every creative brief in that space includes a link back to the strategy as the first reference. Quarterly review of the strategy is a standing meeting on the calendar; the review asks two questions and updates the document if the answers have shifted.
For agencies running creative for multiple clients, the structure is reusable across clients. The seven-row strategy statement, the six-step process, the disambiguation between strategy and brief: all the same. Only the audience, insight, message, and big idea change per client. Build the template once, duplicate the space per client, and the same operating discipline scales.
"Creativity is an approach, rather than just the output." - Ana Andjelic, brand strategist (via Substack)
Andjelic's framing is what separates teams that ship work that compounds from teams that ship more polished assets faster. A strategy treats creativity as a way of working: an insight the team takes seriously, a message the team rallies around, a review cadence that keeps the work honest. Output without that approach gets prettier and produces less.
The creative strategy fits inside the broader operating model. The marketing plan sits upstream and provides the goals the strategy inherits. Campaign management handles the operational running of campaigns the strategy gives birth to. Marketing KPIs close the measurement loop. Each piece does one job; the strategy is the document that connects audience insight to the work that ships.
Common pitfalls
The mistakes below show up across teams that intend to build a real creative strategy and slowly drift back to ad-hoc briefs. Most are pattern-recognition failures, not analytical ones.
Confusing strategy with the briefThe brief tells the team what to make. The strategy tells the team why this work matters and what the audience should walk away believing. Skip the strategy and every brief becomes a coin flip; the team makes assets, sometimes good, rarely connected to a story. The strategy is the document the brief inherits from.
Skipping insight to get to the message fasterInsight is the slowest step and the most often skipped. Teams pull a generic positioning line from the brand book and call it the message. The work that lands starts with an insight the audience recognizes about themselves; the work that does not starts with a feature list dressed in adjectives.
Picking channels before audience"We need to be on TikTok" is a tactic dressed as a strategy. Channels are downstream of where the audience pays attention in a state of mind that matches the message. A great message in the wrong channel reads as noise; a good-enough message in the right channel converts.
No success metric in the strategyStrategies without a defined metric become permanent. Nobody can say whether the work is landing, so the work continues. Tie the strategy to a leading indicator and a lagging business outcome at the start; if either misses by month three, the strategy is wrong, not the creative team.
Never reviewing the strategyInsights age. Categories shift. Audience priorities change. A creative strategy written eighteen months ago and never updated is producing work against a reality that no longer exists. Quarterly review is the minimum cadence; agencies that review monthly tend to ship sharper work because the gap from insight to creative stays small.
The biggest of the five is the first one. Confusing strategy with the brief is how teams end up writing the brief twice, the second time after the work has gone in the wrong direction. The strategy is the upstream document; the brief is the downstream artifact. If your team only has one of the two, the missing one is doing damage you can quantify in revision rounds.
How to start your creative strategy this quarter
If you have brand strategy and creative briefs but nothing in between, start with one client or one campaign and write the strategy for it. The seven-row statement format above is enough; do not over-engineer the document on the first try.
Three moves to start this week. Pick one upcoming campaign or client account that needs a strategy. Run a 60-minute interview with the team or client that closes step two (the audience insight); insight is the slowest step and the one that produces the most value. Fill in the seven-row statement with the team in a 90-minute working session, then circulate it for one round of edits before the next brief inherits from it.
Run the creative strategy where the team writes the briefs. Rock combines chat, tasks, and notes in one workspace. One flat price, unlimited users. Get started for free.
Resource allocation is how a team decides where capacity goes. It is Wednesday morning. The senior designer can take five more hours, the lead developer is already at 110 percent, and a new client has just confirmed a project that needed a start date last Monday. The team has the people. The question allocation answers is which of those people work on what, this week, this month, and at what priority.
This guide covers what resource allocation actually is and how it differs from capacity planning. It walks through the six-step weekly process, the methods, how to build the matrix, and the common pitfalls. The closing section covers what good allocation looks like inside an agency operating model.
What is resource allocation?
Resource allocation is the practice of assigning available people, hours, and budget to specific projects or tasks, in priority order, against a defined time horizon. It is the decision layer that turns capacity into action. Capacity planning answers "do we have enough?"; resource allocation answers "where should it go?" Two different questions, two different artifacts, one feeds the other.
The output of resource allocation is the allocation matrix: a grid showing who is working on what, for how many hours, in a given period. The matrix is the standing artifact of the discipline. Update it weekly and the team has a shared view of where the work sits; skip the update and allocation drifts back into ad-hoc requests and over-promised deadlines.
Resource allocation matrix
Edit cells with the +/- toggles. Rows turn red when someone is over-allocated, yellow when under-used. Project columns flag mismatches between allocated hours and demand.
Project
iDefault allocation balanced. Edit any cell to see what happens when one person carries too much or a project is short on hours.
Allocating across clients? The matrix lives next to the work in Rock, where assignees, hours, and capacity stay visible without a separate spreadsheet.Try Rock free
Edit any cell in the matrix above to see how allocation reshapes when one person is over-loaded or a project is short on hours. The rest of this guide covers the process, the methods, and the pitfalls that turn allocation from a discipline into wallpaper.
What we recommend
At Rock we run resource allocation at two cadences. Weekly at the role level: who is working on what this week, where is the bottleneck, where is the slack. Daily at the project level inside the team workspace: assignees on tasks, hours on cards, capacity visible without a separate tool. The matrix lives next to the work, not in a parallel spreadsheet, and the weekly review is a 15-minute standing meeting tied to the matrix.
The single most useful discipline is starting allocation from the bottleneck role. Most agencies have one role that gates everything: the senior designer, the lead developer, the head of strategy. Allocate that role first, then fit the rest of the team around it. Allocation in aggregate hides bottlenecks; allocation that names the bottleneck makes the constraint visible early.
"An hour lost at a bottleneck is an hour out of the entire system. An hour saved at a non-bottleneck is worthless." - Eli Goldratt, The Goal
Goldratt's frame is the cleanest argument for bottleneck-first allocation. The team that allocates around the constraint compounds; the team that allocates evenly across all roles drowns the constraint and starves the rest. The matrix is the place this discipline shows up; the bottleneck role gets the first hours, the rest gets what is left.
The 6-step resource allocation process
The process below is a weekly cycle. Smaller teams can run it in 30 minutes; larger teams take an hour. Either way the cadence matters more than the duration: a weekly 30-minute review beats a quarterly two-hour deep dive every time.
The cadence matters more than the duration: a weekly 30-minute review beats a quarterly two-hour deep dive.
Define the scope and time horizonDecide what you are allocating against. A single project sprint, a quarter of work across all clients, a single month for a retainer? Allocation without a defined horizon turns into a permanent re-arrangement. Most agencies allocate weekly with a four-week visible horizon and a quarterly view for forecasting.
List the resourcesPeople, hours, budget, and any specialized tooling. For each person, name their available hours per week (after the non-billable tax). Capacity calculations live in the capacity-planning step; allocation inherits the number from there. Listing fewer resources than you actually have is the most common cause of perpetual over-allocation.
Check capacity firstBefore assigning anyone to anything, confirm the capacity numbers from your capacity-planning exercise are still current. Allocations made against stale capacity numbers produce promises the team cannot keep. Update once a quarter at minimum, or whenever the team composition changes.
Assign by priority, not by availabilityThe highest-value work gets the best person, not the next available person. Most teams reverse this and end up with senior people on routine work and juniors on stretch assignments. Run priority through a simple lens: revenue impact, strategic value, or client retention risk, then assign accordingly.
Resolve conflicts explicitlyTwo projects need the same person at the same time. This is not an exception, this is the work of allocation. The decision rule should live in the matrix: priority project gets the hours, lower-priority project either waits, gets a substitute, or gets cut. Avoiding the decision is how scope creeps quietly across the whole team.
Review weekly, retro quarterlyAllocation that is not reviewed becomes wallpaper. A 15-minute weekly review with the matrix open catches the drift before it costs anyone a weekend. The quarterly retro looks at where allocations consistently exceeded plan and asks why; that is where capacity calculations get updated for the next cycle.
The biggest of the six steps is the fourth: assigning by priority, not by availability. Most teams default to "who is free?" and end up with senior people on routine work. The team that compounds asks "who is best?" and accepts that the answer is sometimes "wait." RACI is useful here for naming who is responsible per project, especially when allocation crosses functional boundaries.
Resource allocation methods compared
Several methods exist, each suited to a different work pattern. Most agencies use two or three in combination rather than picking one. The table below summarizes the main methods, what they optimize for, and what to watch out for.
Method
What it does
Best for
Watch out for
Critical path method
Identifies the longest dependency chain in a project; allocates resources to keep the critical path moving on time
Multi-task projects with hard dependencies
Adds planning overhead; weak fit for retainer or always-on work
Resource leveling
Adjusts task start dates so total demand never exceeds available capacity
Teams that hit overload often; projects with flexible deadlines
Pushes deadlines later; commit to it or expect surprises
Resource smoothing
Holds the deadline fixed and re-arranges tasks within float to even out demand
Fixed-deadline projects with some scheduling flex
Limited by available float; not always possible
Time-purchased
Buys outside capacity (contractors, freelancers) when internal allocation is full
Spike demand without permanent hires
Margin pressure; quality control risk; relationship overhead
Predictive scheduling
Uses historical project data to forecast resource demand and pre-allocate accordingly
Mature teams with several seasons of data
Garbage in, garbage out; needs clean time-tracking
Priority-based allocation
Ranks projects by priority and allocates the best people to the top of the list first
Agencies with mixed retainer and project work
Demands a real priority decision; punts when leadership avoids the call
The pragmatic call for most agencies: priority-based allocation as the day-to-day method, with resource leveling triggered when the team hits overload, and time-purchased (contractors, freelancers) for predictable spike demand. Critical path adds value on multi-task projects with hard dependencies but adds planning overhead that retainer work rarely justifies.
How to build the allocation matrix
The allocation matrix is the artifact that makes the discipline visible. It does not need to be sophisticated; a clean spreadsheet works. What matters is the structure, who maintains it, and how often it gets updated.
The cells are where allocation lives; the row and column totals are where the diagnostic value sits.
Component
What it shows
Why it matters
Rows: people
Each team member with weekly capacity (e.g. 32 billable hours)
Capacity is the upper bound; a row that exceeds it is the warning sign
Columns: projects or weeks
Active projects (or upcoming weeks) the team is allocating against
Forces the work to be visible by name, not by abstract "work"
Cells: hours
The number of hours each person spends on each project
The actual allocation decision; everything else is structure around this number
Row totals
Sum of hours per person; compared against capacity
Surfaces over-allocation immediately; the most-watched cell of the matrix
Column totals
Sum of hours per project; compared against demand
Surfaces understaffed projects before deadlines slip
Priority labels
P1/P2/P3 or strategic ranking on each project column
Settles allocation conflicts when demand exceeds capacity
RACI overlay
Optional layer naming who is responsible, accountable, consulted, informed per project
Helpful when allocation crosses functional boundaries
The cells of the matrix are where allocation lives, but the row and column totals are where the diagnostic value is. A row that exceeds capacity is the warning to redistribute or descope. A column that falls below demand is the warning a project is heading for missed dates. Most allocation conversations start at one of these two boundaries.
"If your utilization is less than 60%, you're crawling. Focus on getting paid for the time you're already spending and then you'll be walking." - David C. Baker, Punctuation
Baker's frame is the right calibration for agencies. Allocation that delivers 50 percent utilization is too much slack. Allocation that delivers 95 percent utilization is over-allocated; it ignores the non-billable tax that always comes back. The healthy band sits between 65 and 80 percent, which is the same band capacity planning uses for the calculation upstream.
The data behind nimble allocation
Resource allocation is one of the most underrated levers in business performance. McKinsey research on capital reallocation across S&P 500 companies (1990 to 2013) found a striking gap. Companies in the top third of reallocators delivered 10.8 percent annual returns to shareholders, compared to 2.5 percent for the bottom third. The pattern was consistent across industries.
The same research found that a third of companies reallocate only 1 percent of their capital from year to year, while the most dynamic companies move closer to 8 percent. Inertia in resource allocation is the default; nimbleness is rare and disproportionately rewarded. The matrix above is the operating-level version of the same lever: teams that revisit allocation weekly compound, teams that set allocation once a quarter atrophy.
"The manager as resource allocator decides who gets what. The most important resource the manager allocates is his or her own time." - Henry Mintzberg, professor of management studies, McGill University
Mintzberg's framework identified resource allocator as one of the ten core managerial roles. The point that gets quoted least and matters most is his observation that the manager's own time is the resource being allocated through every "yes" and every "no." Allocation discipline is leadership discipline; the matrix is the artifact that makes both visible.
Common pitfalls
The mistakes below show up across teams that intend to run real allocation and slowly drift back to ad-hoc requests. Most are pattern-recognition failures, not analytical ones.
Allocating against capacity, not against the bottleneckMost agencies have one role that gates everything: senior designer, lead developer, head of strategy. Allocate the team in aggregate and the bottleneck still drowns. Find the bottleneck role first, allocate it last, then fit everyone else around it. An hour lost at the bottleneck is an hour lost for the whole shop.
Ghost projects on the matrixInternal initiatives, sales support, "small favors" for past clients, hiring panels. They never appear on the matrix because nobody is billing them, but they consume real hours. Either name them as projects with allocated hours, or accept the matrix is a fiction.
Tetris-fitting low-priority work into spare capacityA team member has six hours free this week. The instinct is to fill those six hours with whatever is queued. The team that compounds keeps some slack for rework, urgent client requests, and learning. Filling every cell every week looks productive and burns the team out by month three.
No buffer for rework or revisionsAllocating 100 percent of capacity to forward work assumes nothing comes back. Client revisions, internal QA loops, and reactive support always do. Bake a 10 to 20 percent buffer into the matrix or the buffer happens anyway as overtime.
Updating the matrix less often than the work changesAllocation drift is the slow killer. A matrix updated monthly when projects shift weekly stops describing reality. Either tighten the cadence to weekly, or accept the matrix is for forecasting only and stop using it for real-time decisions.
The biggest of the five is the first one. Allocating against aggregate capacity ignores the bottleneck role; the bottleneck drowns while the rest of the team has slack. Find the bottleneck role first, allocate it last, and run the matrix around it. Agency KPIs will surface the bottleneck eventually as utilization deviates between roles, but the matrix surfaces it weekly.
What this looks like on Rock
At Rock the allocation matrix lives as a board inside the marketing or operations space. People are assignees on cards, hours are custom fields on each card, and the My Tasks view per person rolls up the weekly total. The matrix is not a separate tool; it is a different view of the work that already exists.
Per-person My Tasks view rolls up the weekly total without a separate spreadsheet.
For agencies running multiple clients, the matrix benefits from one extra layer: project priority labels on every card. P1 retainer client work gets allocated first; P2 internal initiatives fill remaining slots; P3 nice-to-haves go to a backlog reviewed monthly. The labels make the priority rule visible to the whole team without anyone needing to remember it.
The broader operating model fits together cleanly. Capacity planning calculates the upper bound on hours; resource allocation distributes them; billable hours ties allocation to revenue economics; marketing operations runs the day-to-day execution underneath. Each piece has a different job; the matrix is what connects allocation decisions to the work the team actually ships.
How to start allocating this quarter
If your current allocation is unmeasured (most teams), do not try to instrument every project and every person in the first week. Pick the simplest version that gives you visibility, then improve from there.
Three moves to start this week. List the team and current capacity per person, sourced from your capacity-planning exercise. List the active projects with weekly hour demand for each. Build a simple matrix (people on rows, projects on columns, hours in cells) and review it weekly. The other discipline (methods, priority labels, RACI overlays) fills in over the first month.
Run the allocation matrix where the team works. Rock combines chat, tasks, and notes in one workspace. One flat price, unlimited users. Get started for free.
A marketing funnel is the model that maps how strangers become customers. Visitors arrive, some engage, fewer convert to leads, fewer still buy, and a smaller group sticks around. Every stage loses people. The plan that wins is the one that knows where the loss is biggest and what to do about it.
This guide covers what a marketing funnel is, the stages most teams use, and the metrics and conversion rates that flag a leak. It walks through the diagnostic for finding where your funnel breaks, the digital and B2B variants, and how the funnel sits inside the broader marketing plan.
What is a marketing funnel?
A marketing funnel is a model that breaks the customer journey into stages, from first awareness to repeat purchase, with conversion rates between each stage. The shape is metaphorical: more people enter at the top, fewer exit at the bottom. The model traces back to E. St. Elmo Lewis in 1898 and persists because it does one thing well: it gives marketing teams a shared language for where buyers drop off and a structure for diagnosing why.
The funnel is not a strategy. It is an analytical lens. The plan that uses the funnel decides what to do; the funnel tells you where to focus. A marketing plan without funnel thinking measures activity; a marketing plan with it measures movement through stages.
Funnel diagnostic
Top of funnel: monthly visitors
Found a leak? Fixing it is team work, not analyst work. Rock keeps the brief, the tasks, and the chat in one workspace so the diagnosis turns into shipped fixes.Try Rock free
Edit any conversion rate in the diagnostic above. The stage that drops most below typical gets flagged automatically. The rest of this guide explains the stages, the typical rates, where most funnels actually leak, and how the digital and B2B variants change the rules.
The stages of a marketing funnel
Three-stage, four-stage, and five-stage models all describe the same shape. Pick what your team can measure consistently. The five-stage version below is the most common and covers retention as a marketing concern, which the older three-stage models ignore.
Three-stage, four-stage, or five-stage models all describe the same shape; pick what your team can measure consistently.
Awareness. The audience does not know you exist. The job is reach to people who match the personas. Reach is hard to attribute and easy to inflate; the leading indicators are branded search volume and engaged sessions on owned channels, not impressions on someone else's platform.
Interest (or Consideration upper). Visitors arrive and decide whether to spend more time. The first scroll, the first 30 seconds, the first headline either earns the next click or loses it. Most awareness work fails here, not at the top.
Consideration (or evaluation). Engaged users decide whether to identify themselves. They fill a form, download a resource, start a trial, or open an account. This stage is the most common leak in B2B because the offer-to-friction ratio is wrong.
Decision (or conversion). Leads decide whether to buy. The signals here are different per business: demo bookings for SaaS, pricing-page visits for services, cart-completion for ecommerce. Sales-and-marketing handoff cleanliness lives at this stage.
Retention (and advocacy). Buyers decide whether to come back, expand, and recommend. Most funnels stop at decision; the ones that compound treat retention as a marketing stage with its own KPIs and content.
Metrics and conversion rates by stage
The diagnostic value of a funnel comes from comparing your conversion rates against a reasonable typical range, not from staring at your own numbers in isolation. A 25 percent conversion looks fine until you learn the typical range is 35 to 45 percent for that segment.
The diagnostic value of a funnel comes from comparing your rates against a typical range, not from staring at numbers in isolation.
Stage
What to measure
Typical conversion
Leak signs
Awareness
Reach, impressions, branded search volume
n/a (entry stage)
Thin organic traffic, low brand search, paid not delivering reach
Interest
Engaged sessions, time on page, scroll depth past hero
25 to 40% of visitors
High bounce, sub-30-second sessions, exit on the first scroll
Consideration
Form fills, content downloads, account creation, MQLs
5 to 15% of engaged users
Engaged users do not convert, form abandonment, low CTA click-through
Decision
Demo bookings, trials started, purchases, SQLs
10 to 25% of leads
Leads stall before buying, slow sales response, pricing-page bounce
Retention
Repeat purchase, expansion revenue, renewal, NPS
50 to 70% of buyers
One-and-done buyers, low product activation, no expansion motion
The ranges above are directional. B2B SaaS, B2C ecommerce, marketplaces, and services all run different absolute numbers. The discipline that matters is comparing your stages against your own historical rates AND a defensible external benchmark; teams that only do one or the other miss leaks.
"The most useful metaphor that people have found to describe a sales or conversion process is a leaky funnel." - Andrew Chen, partner, Andreessen Horowitz
Chen's frame is the right test for whether the funnel is doing its job. The model is useful precisely because it makes the leaks legible. A plan that pretends the funnel does not leak ships activity; a plan that names the leak ships fixes.
Where funnels leak and how to find the leaks
Every mature funnel has one or two stages responsible for 60 to 80 percent of total drop-off. The leaks are not evenly distributed. Find the worst leak first, fix it, then move to the next.
The diagnostic process is three steps. First, calculate the conversion rate at each transition (visitors to engaged, engaged to leads, leads to buyers, buyers to repeat). Second, compare each rate against a typical range and against your own historical baseline. Third, prioritize the stage with the largest gap from typical, not the largest absolute number of dropped people. A stage losing 10,000 visitors at a healthy 70 percent rate is fine. A stage losing 500 leads at a 5 percent rate when typical is 15 percent is the actual problem.
Optimizing the wrong stageMost teams focus their fix energy on the top of the funnel because reach is easy to measure. Awareness is rarely the leak. Mature funnels lose 60 to 80 percent of total volume at one or two specific stages, usually consideration or decision. Find the leak before you spend a quarter chasing more visitors.
Mistaking absolute volume for conversion rateA stage that loses 5,000 people sounds dramatic but might be perfectly normal. A stage that loses 30 percent of its predecessor when typical is 10 percent is the actual problem. Read your funnel in conversion rates first, absolute drops second.
Skipping retention from the funnelMost funnels stop at decision because the marketing team owns up to that point and customer success owns after. The plan that compounds includes retention as a marketing stage, with expansion offers, referral motions, and reactivation campaigns. Funnels without retention model linear growth at best.
No shared KPI dictionary across channels"Engagement" means something different to the social team than to the email team. "Conversion" is one number to paid and another number to content. The funnel rollup becomes a translation exercise the team eventually skips. Write one definition per metric and use it everywhere.
Treating the funnel as the only modelMcKinsey's consumer decision journey, growth loops, and the flywheel critique are not wrong; they add nuance for businesses that compound through retention, network effects, or word of mouth. Use the funnel as a diagnostic lens, not a worldview. The stages are still useful for measurement; they are not the whole story.
The biggest of the five pitfalls above is the first. Most teams optimize the top of the funnel because reach is easy to measure. Awareness is rarely the leak. Mature funnels lose most of their volume in the consideration and decision stages; that is where the fix energy belongs.
Digital marketing funnel
A digital marketing funnel applies the same five stages to digital-only channels: SEO, content, social, email, paid search, paid social, display. The difference is that channels overlap. A buyer might first see you on TikTok, then Google your name a week later, download a guide from your site, get retargeted on LinkedIn, and convert from a branded paid search ad. Single-channel attribution misses 80 percent of that path.
The shared-KPI column is the integration discipline. If three channels are funding the consideration stage, all three report the same definition of qualified leads, even if their tools call it something different. Without it, the cross-channel readout becomes a translation exercise.
B2B and SaaS marketing funnels
B2B funnels behave differently because B2B buying is collective and slow. Gartner research finds that buyers spend just 17 percent of their time meeting potential suppliers. A typical buying group has 11 to 20 stakeholders touching 27 channels on average before deciding. The funnel still applies; the math gets harder.
B2B buying is collective and slow; the funnel still applies but the math gets harder.
Three adjustments for B2B. First, account-level measurement matters more than person-level. A 12-person buying committee will show as 12 separate "leads" in the funnel; treating them as one account closes the gap. Second, stages widen: consideration in B2B is months, not days, with multiple touches and stakeholders. Third, retention is part of the funnel, not after it; expansion revenue and renewal are how SaaS economics actually work.
For SaaS specifically, the funnel often extends one stage further: aware → engaged → trial → paid → retained → expanded. The expansion stage has its own conversion rate, and it is the one most marketing plans skip. Tie it back to the broader marketing KPIs so the retention layer earns the same attention as acquisition.
The funnel's limits and modern critiques
The funnel is useful but not complete. McKinsey's consumer decision journey argues that buyers loop through evaluation, often re-entering at the consideration stage from existing customer relationships. The flywheel critique frames retention as the engine that powers acquisition through advocacy and word of mouth. Brian Balfour's growth loops describe businesses where one customer's action creates the next customer (referral, content, virality, paid recycling).
"Growth loops compound momentum, whereas funnels run out of fuel." - Brian Balfour, Reforge
Balfour's frame is the cleanest critique. The funnel models a one-way pipeline; loops model a self-reinforcing system. Both are useful at different scales. Use the funnel as a diagnostic lens for stage-by-stage measurement; use loops to design the retention and referral mechanics that compound. The plan that holds both is more honest than the plan that picks one.
What we recommend
At Rock we run funnel diagnostics inside the same workspace where the team works. The funnel definition lives as a pinned note. Stage KPIs live as a board with one card per stage and the current rate visible. Weekly status check on the leading indicators, monthly readout against the full funnel, quarterly retro that decides which leak to fix next. The point of the diagnostic is not the dashboard; it is the conversation about which stage to attack next.
Pin the funnel definition and the leak diagnosis next to the work that fixes the leaks.
For agencies running funnels for clients, the diagnostic is also the cleanest selling artifact. Show the client where their funnel leaks against benchmarks, and the next month of work writes itself. The integration with the broader operating model sits in marketing operations for execution and campaign management when a campaign needs to lift a specific stage.
"Your customers' journeys are their stories, not funnels." - Bryan Eisenberg, author and conversion optimization expert (bryaneisenberg.com)
Eisenberg's frame is the right closer. The funnel is a tool, not a worldview. Customers do not experience their buying as five tidy stages; they experience it as a story with hesitations, returns, and recommendations. The funnel helps the team measure; the story is what the team designs against.
How to start using the funnel this quarter
If your funnel is unmeasured (most teams), do not try to instrument every channel and every stage in the first week. Pick the simplest version that gives you a leak signal, then improve from there.
Three moves to start this week. First, define the five stages in your specific terms (what counts as awareness, interest, consideration, decision, retention for your model). Second, pull the conversion rate at each transition for the past 90 days; spreadsheet is fine. Third, compare each rate against a typical range using the table above and the diagnostic widget at the top. The biggest gap is your priority for the next quarter.
Pin the funnel diagnostic where the team works, alongside the briefs and tasks that fix the leaks. Rock combines chat, tasks, and notes in one workspace. One flat price, unlimited users. Get started for free.
A digital marketing plan is the umbrella that ties your channels together. SEO, content, social, email, paid search, paid social, display, webinars: each one has its own plan and its own KPIs. The digital plan is the layer above them that decides how they feed each other, who owns the budget split, and how performance rolls up across channels. Most teams skip this layer and end up with five plans that never meet.
This guide covers what a digital marketing plan actually is and how it differs from your broader marketing plan. It walks through the channel-to-funnel mapping, the integration logic between channels, the budget allocation, and the cross-channel measurement layer that ties social, content, and paid back to revenue. Read on if your team is running multiple digital channels but cannot tell you how they connect.
A digital marketing plan is the layer above the channel plans, not another channel plan.
What a digital marketing plan is
A digital marketing plan is the document that says how your digital channels work together to reach your audience, move them through the funnel, and convert them. It sits inside the broader marketing plan and inherits its goals. The plan is not another channel plan. It is the layer above them, defining how SEO feeds the newsletter, how social validation feeds paid search, and how email retention feeds referral.
The line between this plan and the pillar matters. The broader marketing plan covers all marketing including events, partnerships, PR, and offline. The digital plan covers the online channels and the integration logic between them. The two are not duplicates; they are different scopes. According to the Gartner 2025 CMO Spend Survey, digital channels account for 61.1 percent of total marketing spend. The plan that runs that 61 percent deserves its own document.
The five layers of a digital plan
Most digital plans confuse five distinct layers and treat them as one document. Pulling them apart makes the plan tractable.
Channels. The list of digital surfaces you will show up on. SEO, content, social, email, paid search, paid social, display, webinars, podcasts, partnerships. The plan picks two or three to win, not all of them at token spend.
Funnel. How channels map to the stages of the audience journey. Awareness, interest, consideration, decision, retention. Each channel earns specific stages; few channels work across all of them.
Budget. How money splits across channels. Not the channel-by-channel budget (each channel plan handles that), but the rollup that says how the digital total is allocated.
Operations. Who runs what, in what cadence, against what brief. The same brief format across channels, the same review cadence, the same campaign-level rollup.
Measurement. The KPI dictionary the team uses across channels. Without it, the social team's "engagement" means something different from the email team's "engagement" and the cross-channel report becomes a translation exercise.
The pillar marketing plan covers seven sections of plan structure (audience, goals, channels, budget, calendar, owners, measurement); these five layers are how the digital execution actually runs. Different unit of analysis, designed to sit underneath the pillar without duplicating it.
Map your channels to the funnel
The funnel is the integration backbone. For a deeper diagnostic on stage-by-stage leaks, see the marketing funnel guide. Without a shared funnel, each channel optimizes for itself and the team has no way to read whether they are working together. The five-stage funnel below works for most digital businesses; adapt the language for your model, not the structure.
The funnel is the integration backbone; without a shared funnel, each channel optimizes for itself.
Awareness (top of funnel)The audience does not know you exist. The job is reach to people who match the personas. Channels that earn this stage: organic social, short-form video, paid social, display, podcast guest spots, PR. The KPI is reach across channels combined, not reach on any single one. Plans that try to attribute revenue to top-of-funnel touches are usually measuring the wrong thing.
Interest (upper-middle)The audience knows you exist and is sizing up whether to learn more. Channels that earn this stage: SEO content, YouTube long-form, newsletter, LinkedIn thought leadership, retargeting display. The shared KPI is engaged time on owned property, plus newsletter sign-ups as the cleanest cross-channel proxy.
Consideration (lower-middle)The audience is comparing you to alternatives. Channels that earn this stage: comparison pages, demo videos, case studies, webinars, paid search on bottom-of-funnel keywords, review-site presence. The shared KPI is qualified leads, demo bookings, or trial starts depending on the model.
Decision (bottom of funnel)The audience is ready to buy and is choosing a vendor. Channels that earn this stage: branded paid search, sales-enabled email sequences, pricing-page optimization, retargeting on cart abandonment, sales outreach armed with content. The shared KPI is closed-won revenue and assisted conversions across channels.
Retention and expansion (post-funnel)The audience is a customer and the digital plan keeps them and grows them. Channels that earn this stage: customer email, in-app messaging, customer-only community, expansion content, referral programs. The shared KPI is net revenue retention and expansion bookings, not opens or clicks. Most digital plans skip this layer; the ones that include it compound faster.
"The root cause of failure in most digital marketing campaigns is not the lack of creativity in the banner ad. It is quite simply the lack of structured thinking about what the real purpose of the campaign is and a lack of an objective set of measures." - Avinash Kaushik, Digital Marketing and Measurement Model
Kaushik's measurement model predates most of the channels in your stack and still applies. Each funnel stage needs a stated purpose and a stated measure. Lose either one and the plan defaults to activity, not outcomes. The deeper channel-by-channel work happens in the SEO marketing plan, content marketing plan, and social media marketing plan; the digital plan is what holds them together.
How the channels feed each other
Channels that work in silos cost the same as channels that integrate, and produce a fraction of the revenue. The integration table below maps the most common digital channels against three things: what each channel feeds, what feeds it, and the shared KPI that proves the integration is working.
Channels that work in silos cost the same as channels that integrate, and produce a fraction of the revenue.
Channel
Feeds into
Fed by
Shared KPI
SEO and content
Newsletter, social repurposing, sales enablement
Keyword research, customer questions, social listening
Organic sessions, branded search, qualified leads
Social media
Newsletter sign-ups, traffic to content, community growth
Newsletter list, social invitations, partner co-promo
Registrations, attended-to-pipeline conversion
Customer email and community
Retention, expansion, referrals, case studies
Product usage data, support themes, customer requests
Net revenue retention, referral rate, NPS
The pattern that emerges is that no channel stands alone. SEO feeds the newsletter list, the newsletter feeds social engagement, social engagement feeds paid amplification of the best posts, paid amplification feeds the next round of SEO content. The plan that maps these flows explicitly is the plan that compounds.
"Two-thirds of your marketing is not your marketing." - Mark Schaefer, author of Marketing Rebellion
Schaefer's frame is the most honest argument for integration. The biggest share of what moves a buyer is happening in conversations the brand does not control: reviews, peer recommendations, social validation, organic mentions. Channels that integrate well give those signals more surface to feed each other. Channels that run in silos miss the conversation entirely.
According to McKinsey's research on omnichannel marketing, B2B customers engage three to five channels per interaction. Companies running integrated omnichannel approaches report 5 to 15 percent revenue growth and 3 to 7 percent improvement in cost-to-serve. The integration is not optional infrastructure; it is most of the value the digital plan creates.
Budget allocation across digital channels
The budget split tells the team where the digital plan thinks growth comes from this year. Three things shape it: the audience and where they pay attention, the funnel stage that needs the most help, and the unit economics of each channel. The Gartner column below is the enterprise-weighted average; the other two columns are how a lean B2B services firm and an ecommerce DTC brand would actually allocate.
Channel
Gartner 2025 average
Lean B2B services
Ecommerce DTC
Paid search
13.9%
20 to 30%
15 to 20%
Display advertising
12.5%
5 to 10%
10 to 15%
Social advertising
12.2%
10 to 15%
25 to 35%
Email marketing
7.4%
5 to 10%
10 to 15%
SEO and content
15 to 20%
30 to 40%
10 to 15%
Events and webinars
5 to 10%
10 to 15%
0 to 5%
Tools and platforms
10 to 15%
5 to 10%
5 to 10%
Contingency
5%
5 to 10%
5 to 10%
The lesson in the columns is that the enterprise average is a poor template for either a B2B services firm or an ecommerce brand. A lean B2B services agency over-indexes on SEO and content because the sales cycle rewards trust and education. An ecommerce DTC brand over-indexes on social and paid social because the purchase decision happens in-feed. The digital plan that copies the enterprise split at SMB scale ends up with token spend across eight channels and growth from none. Capacity planning is the corrective on the headcount side, but the budget choice is what makes capacity tractable.
Free resource: download our marketing plan template to get the strategy notes, annual roadmap, and execution board structure ready to copy into your workspace.
Cross-channel KPIs and the measurement layer
The hardest part of a digital plan is measurement that survives across channels. Each channel ships its own dashboard with its own definitions. The team learns to read each one, and nobody can tell leadership how the channels combined moved the business this month. The fix is a small KPI dictionary the team writes once and uses everywhere.
Three measurement disciplines anchor the cross-channel layer. Shared KPIs across channels for the same goal. If three channels are funding the consideration stage, all three report the same definition of qualified leads, even if their tools call it something different. Assisted conversions as the rollup metric. The last-click view ignores 80 percent of the path; the assisted view shows which channels touched the converter on the way in. Branded search and direct traffic as the cleanest cross-channel proxy. People who see you across channels eventually Google your name; brand-search trend is the cleanest signal that the digital plan is doing its job.
Tie the cross-channel KPIs back to the broader marketing KPIs. A digital plan that does not roll up to the company-wide marketing KPI set quietly underweights itself in the next budget conversation. Cross-channel campaign measurement runs through campaign management; the campaign is the unit, the channels are the components.
A worked digital plan example
The example below is a 25-person B2B services firm running a digital plan for its own brand. $480,000 annual digital budget. Three priority audiences. Two priority funnel stages.
Audience. Two segments. Segment A: heads of marketing at 100 to 500-employee SaaS companies, evaluating new agency partners annually. Segment B: founders of bootstrapped B2B businesses growing past 20 employees, hiring their first marketing function. Segment A is the higher-ticket buyer; segment B is the volume play.
Funnel priority. Interest and consideration. The firm has decent awareness in its niche through founder LinkedIn presence; the gap is converting interest to qualified leads.
Channel mix and budget. SEO and content takes 35 percent ($168K). Paid search takes 20 percent ($96K, defensive on brand plus selective non-brand on three head terms). LinkedIn takes 20 percent ($96K, founder-led plus paid amplification of top organic posts). Email and webinars take 15 percent ($72K), contingency 10 percent ($48K). The firm explicitly skips display, paid social on non-LinkedIn platforms, and influencer partnerships this year.
Integration plan. SEO content feeds the newsletter weekly. Newsletter signups become webinar attendees quarterly. Webinar attendees who engage become sales-qualified opportunities. LinkedIn organic posts that perform get paid amplification within 48 hours. Paid search defends the bottom of the funnel and recycles top non-brand keywords back to the SEO team for content briefs.
Measurement. Shared KPI dictionary at the top. Pages ranking 5 to 20 weekly. Newsletter list growth and engagement weekly. Marketing-qualified leads from each channel monthly. Sales pipeline created with marketing attribution monthly. Branded search volume quarterly. Closed-won marketing-attributed revenue quarterly.
Common pitfalls
The mistakes below show up across digital plans that intend to integrate and slowly drift back into channel silos. Most are pattern-recognition failures, not analytical ones.
Planning channels in silosSEO, content, social, email, and paid each get their own plan, their own KPIs, their own meetings, and never meet. The team is busy, the channels look productive on individual reports, and revenue does not move. The whole point of a digital marketing plan is the layer above the channel plans; without it, you have five plans and no system.
No shared KPI dictionary across channels"Engagement" means something different to the social team than to the content team. "Conversion" means something different to paid than to email. The plan that works writes one KPI dictionary at the top, with the same definition used in every channel report. Without it, the cross-channel readout becomes a translation exercise the team eventually skips.
No campaign-level rollupChannel reports show how each channel performed. Nobody can tell you how a single campaign performed across channels because the rollup does not exist. The fix is naming campaigns explicitly in the plan, tagging them in every channel tool, and pulling the cross-channel view monthly. UTM discipline alone is not enough; the rollup needs to live somewhere the team actually opens.
Copying enterprise budget splits at SMB scaleA 5-person team running a digital plan with the Gartner 13% paid search and 12% display split is allocating money the same way a Fortune 500 does, only at one-thousandth the scale. The right SMB split concentrates on two or three channels at meaningful spend; the broad enterprise allocation is what produces token activity across eight channels and growth from none of them.
Treating digital as "do everything"The plan that lists every channel, every tactic, every emerging platform reads as comprehensive and ships as overwhelm. The digital plan is a choices document, not an inventory. Pick the two or three channels that genuinely matter for the audience this year, defend the choice in writing, and stop apologizing for the channels you said no to.
The biggest of the five is the first one. Plans that ship as five separate channel documents cost the same as integrated plans and produce a fraction of the result. The whole point of a digital marketing plan is the layer above the channels; without it, you have five plans and no system.
What we recommend
At Rock we run digital plans inside the same workspace where the marketing team works. The plan lives as a pinned note in the marketing space. The channel-specific plans (SEO, content, social) live as linked notes. The integration table is the canonical reference the team re-reads when a campaign launches. It answers which channels a campaign touches and what the shared KPI is, before the brief is written. Status updates happen in chat next to the work, not in a separate weekly meeting that everyone half-attends.
The integration table answers which channels a campaign touches and what the shared KPI is, before the brief is written.
For agencies running digital plans on retainer, the integration layer is the most reusable piece of the cluster. The integration table, the funnel mapping, the KPI dictionary, the pitfalls list are the same across most clients; the channel mix, budget split, and audience definition change. Build the digital plan template once, then duplicate the space per client. Marketing operations handles the day-to-day execution underneath the plan, and RACI is useful for naming who owns each channel inside a multi-channel campaign.
"Lead with your humanity and combine the math with meaning. The spreadsheets with the stories. The data with the insight." - Rishad Tobaccowala, author of Restoring the Soul of Business
Tobaccowala's frame is the right balance for a digital plan. The math (channels, funnel, budget, KPIs) is half the document. The meaning (why this audience, why these messages, what the brand stands for) is the other half. Plans that ship with only the math read as media buys; plans that ship with only the meaning read as brand decks. The plan that compounds carries both.
The broader marketing system fits together cleanly. The pillar marketing plan sits upstream and provides the audience and goals this digital plan inherits. The three sibling spokes (SEO, content, social) sit underneath as the channel-specific deep dives. Marketing project management handles the execution layer. The digital plan is what connects them into one system.
How to start your digital plan this quarter
If your channels are running independently (most teams), do not try to write a perfect 12-month integrated plan in the first week. Run a 90-day version against the framework above and use the retrospective to plan the next quarter. The first 90 days are about getting the integration discipline working, not winning every channel.
Three moves to start this week. Write the KPI dictionary: one definition per metric, used across all channel reports. Map the channels to the funnel stages they actually earn. Pick two integration flows to wire up explicitly (SEO content to newsletter, top organic posts to paid amplification) and document them in one paragraph each. The rest fills in over the first 30 days.
Run your digital plan inside the same workspace as the work. Rock combines chat, tasks, and notes in one workspace. One flat price, unlimited users. Get started for free.
A social media marketing plan is the social-specific layer of your broader marketing plan. It says which platforms you will show up on, what you will post, and how often. It also names who runs the conversation when the post lands and how you will measure whether any of it is moving the business. Most plans cover the first three and skip the rest.
This guide covers what goes into a social media marketing plan and how to pick the channels worth your time. It walks through the production pipeline that keeps the calendar honest and the community management discipline that decides whether posts compound or disappear. Read on if your team is publishing but cannot tell you whether anything is landing.
A social media marketing plan keeps the team and the conversation in one place, instead of scattered across five tools.
What is a social media marketing plan?
A social media marketing plan is the document that says who you are reaching on social, what you will post, where you will post it, and how often. It sits inside your broader marketing plan and inherits its goals. The plan is not a content calendar, though it produces one; it is the operational layer that decides which platforms earn your time and what you publish on them.
According to DataReportal's Digital 2026 report, 5.66 billion social user identities exist worldwide, with the average user active on 6.75 platforms. The audience is huge, fragmented, and changing fast. A plan is what stops the team from chasing every shiny object.
What goes in a social media marketing plan
A good plan is short. Six sections, each tight enough that the team will actually re-read them. The structure below works for in-house brand teams, agencies running social for clients, and founders posting from the company account themselves.
Section
What it answers
Common mistake
Audience and goals
Who are we trying to reach, and what does success look like?
Goals like "grow followers" with no business outcome attached
Content pillars
Three or four big themes the account will own
Posting whatever the team thinks of that morning
Channel mix and cadence
Which platforms, how often, in what format?
Being everywhere instead of being good somewhere
Production pipeline
How does each post get briefed, made, approved, and published?
One person doing everything, with no backup or queue
Community management
How fast do we respond, and what is our voice?
Treating community as cleanup work after the post ships
Measurement
What numbers tell us this is working?
Reporting reach and impressions, ignoring shares and saves
The biggest mistake is starting with the calendar. The calendar is the output, not the plan; without the audience, pillars, and channel mix above it, the calendar drifts to whatever the team thought of that morning. Nielsen Norman Group's content strategy framework makes the same case from a UX angle: structure informs content, content informs the experience. Skip the structure and the plan defaults to noise.
Audience and content pillars
The audience comes first. Two or three personas, written in enough detail that the team knows when to say no. Pew Research's Americans' Social Media Use survey shows how fast the platform mix changes by age and segment. Among US adults, 84 percent use YouTube, 71 percent Facebook, 50 percent Instagram, 32 percent TikTok, 25 percent LinkedIn. The plan that picks platforms by gut wastes most of its hours on the wrong feed.
Pick the channels where the audience actually pays attention. Three is usually the right number for a small team.
Once the audience is named, content pillars decide what you actually post. Three or four big themes the account will own, each one mapped to a stage of the audience journey. We cover the full pillar discipline in the content marketing plan guide. For the integration layer above all digital channels, see the digital marketing plan. Search-driven social distribution (TikTok and YouTube as discovery surfaces) sits inside the SEO marketing plan. For social specifically, the pillars are the same; the formats are platform-native, like a LinkedIn carousel, a TikTok reel, or an Instagram story.
Vaynerchuk's frame is the right test for whether a plan respects the platform. Repurposing the same post across LinkedIn, Instagram, TikTok, and X without adapting it is content; adapting the hook, the format, and the runtime to each platform is content marketing. The plan that wins picks the pillars, then designs natively for each channel.
Free resource: download our marketing plan template to get the strategy notes, annual roadmap, and execution board structure ready to copy into your workspace.
Channel mix and posting cadence
Pick the platforms where the audience actually pays attention. Three is usually the right number for a small team; four if the audience genuinely splits, and never more than that as a starting point. Concentration beats breadth on social the same way it does on every other channel.
Channel
Best at
Format priority
Realistic cadence
LinkedIn
B2B reach, professional audiences, thought leadership
Text posts, carousels, native video, articles
3 to 5 posts per week per active author
Instagram
Brand identity, visual products, lifestyle
Reels, carousels, photo posts, stories
3 to 5 posts per week, daily stories
TikTok
Reach, short-form video, discovery for younger audiences
Native short vertical video
3 to 7 posts per week, plus reactive content
X (Twitter)
Real-time conversation, tech audiences, customer service
Text posts, replies, threads
Daily activity, more during launches
YouTube
Search-driven discovery, deeper explanations
Long-form video, shorts, livestream
1 to 4 long-form pieces per month, plus shorts
Facebook
Community groups, broad demographics, paid amplification
The cadences above are realistic for a small team. The trap is committing to a frequency the team cannot maintain past month two. Better to post three times a week consistently than to post daily for a month and then disappear. Cross-platform note: a LinkedIn post does not become a TikTok post by reposting it. Each platform has its own format expectations and reposting identical content reads as low effort to the algorithm and to the audience.
Production and publishing pipeline
Every post should run through the same production pipeline, even if the steps take ten minutes total. Skipping the pipeline is how plans drift into improvisation; running the pipeline is how the calendar stays honest.
Every post should run through the same production pipeline, even if the steps take ten minutes total.
BriefEach post starts with a short brief, even if it lives in one line. Pillar, audience, format, hook, success metric, owner. Posts without a brief tend to read as filler; the audience can tell.
ProduceCopy, design, video, photography. The platform-native format matters more than production polish; a phone-recorded LinkedIn video often outperforms a polished agency edit. Match the format to the platform, not to the production budget.
Review and approveA second set of eyes runs the post against the brief, the brand voice, and any sensitivity checks. Long approval cycles are the most common cause of slipping social calendars; a 24-hour approval window built into the workflow saves more time than any scheduling tool.
ScheduleQueue the post in the scheduling tool with the right time, channel, and assets. Cross-posting the same content to every platform is a common shortcut; the post that lands on LinkedIn rarely lands the same way on TikTok. Adapt per platform or skip the platform.
PublishThe post goes live. The first hour matters; the algorithm decides whether to push the piece based on early engagement signals. Plan to be present in the first 60 minutes after publish for replies and edits.
EngageReply to comments, answer DMs, jump into related threads. Engagement is part of the post, not the cleanup after. The cost of skipping it is the post that performs once, then disappears, instead of compounding.
Measure and learnPull the numbers from the success metric named in the brief. Compare to the last five posts in the same pillar. Document what worked and what did not, and feed it into next week's brief. Weekly retros beat monthly ones for social; the cycle is too fast for monthly review to keep up.
The most under-appreciated step is the last one. Weekly retros beat monthly ones for social because the cycle is fast; what worked last week often does not work next week. The retro is what turns the production line into a learning system. Run it as a project, not a doc, and the calendar compounds.
Community management and crisis response
Community management is part of the post, not the cleanup after. The first 60 minutes after publish are when the algorithm decides whether to push the piece, based on early engagement signals. The team needs to be present, not posting and walking away. Reply to comments, answer DMs, jump into related threads. The cost of skipping this step is the post that performs once and then disappears.
The first 60 minutes after publish are when the algorithm decides whether to push the piece. Be present, not posting and walking away.
Three rules keep community management consistent. First, response time targets, scaled by channel: under two hours on X and Instagram during business hours, under 24 hours on LinkedIn and Facebook. Second, brand voice consistency: write a one-page voice doc with examples of how to handle praise, complaints, and questions, and make it the second thing every new team member reads. Third, an escalation path: name who handles a comment that needs legal review, who handles a public complaint about a product issue, and who decides when to delete versus respond.
The crisis side is rare but expensive. Plan for it before it happens. Most crises follow a predictable shape: a single comment, post, or screenshot goes wide, the team scrambles to respond, the response creates the next news cycle. The plan that holds is the one with a written first-response template, a named decision-maker, and a holding statement ready before anyone needs it. RACI is useful here for naming who decides versus who informs.
"Content is king, but engagement is queen, and she rules the house." - Mari Smith, social media strategist (via X)
Smith's frame predates the algorithm changes that made it true at scale. Posts that drive engagement get distribution; posts that get distribution drive engagement. The team that treats engagement as the work, not the cleanup, builds the audience that compounds.
"Answer every customer complaint, in every channel, every time." - Jay Baer, author of Hug Your Haters
Baer's research with Edison found that around a third of customer complaints go unanswered; the brands that respond consistently turn complaints into retention. The Edelman 2025 Trust Barometer reinforces the point from the audience side: four in ten consumers say they will not form an emotional attachment to a brand without social interaction. Community management is not optional infrastructure on a social plan; it is most of the value.
Measurement: leading vs lagging indicators
Measurement on a social plan should be tight. Reach and impressions are what platforms surface most easily, which is why most reports lead with them. They are also the noisiest. Saves, shares, and comments are stronger signals because they require the audience to do something, not just see something.
KPI
Type
Why it matters
Cadence
Saves and shares
Leading
The cleanest signal that the audience finds the content useful enough to revisit or amplify
Weekly
Comments per post
Leading
Conversation depth beats reach; high comments-to-reach ratio predicts community growth
Weekly
Direct messages received
Leading
Inbound interest, often from buyers and partners
Weekly
Profile visits and follows
Leading
Audience growth from content, not buys
Monthly
Branded search volume
Lagging
People who saw you on social and now Google your name
Monthly
Click-throughs to site
Lagging
Conversion-side measurement that ties social back to revenue
Monthly
Share of voice
Lagging
Mentions and conversations relative to direct competitors
Quarterly
Split the KPIs into leading and lagging indicators. Leading indicators (saves, shares, comments, DMs) tell you whether content is working this week and what to adjust next. Lagging indicators (branded search, click-throughs, share of voice) tell you whether social is moving the business and belong in the monthly readout to leadership. For the cross-channel diagnostic of where social fits in the buyer journey, see the marketing funnel guide. Tie both back to the broader marketing KPIs; an isolated social dashboard tends to underweight itself in business conversations.
Common pitfalls
The mistakes below show up across social plans that intend to compound and slowly drift back into a publishing schedule with no system underneath. Most are pattern-recognition failures, not analytical ones.
Being everywhere instead of being good somewhereA small team running five platforms with a thin presence on each loses to a team running two platforms well. Pick where the audience actually is, win those, then add a third. Concentration beats breadth on social the same way it does on every other channel.
Cross-posting the same content to every platformA LinkedIn carousel does not become a TikTok video by reposting it. Each platform has its own format expectations, audience, and tone. Repurposing is fine, even encouraged. Identical reposts read as low effort and the algorithms know it.
Treating community management as cleanupEngagement is part of the post, not the work that happens after. Replies, DMs, and conversations are where the audience decides whether to come back. Plans that budget for production but not for engagement publish more and grow less.
Reporting reach, ignoring savesReach and impressions are the metrics platforms surface most easily, which is why most reports lead with them. They are also the noisiest. Saves and shares are stronger signals because they require the audience to do something, not just see something. Build the report around the metrics that change behavior.
For agencies, your own social losing to client workIf your agency posts for ten clients but has not updated its own brand account in three months, the brand account is the canary. The team that creates for clients is the team that creates for the brand; capacity is finite. Bake the brand-social hours into the staffing model or expect the brand calendar to slip every time client work tightens.
The biggest of the five is the third. Engagement is not cleanup; it is the work. Plans that budget for production but not for engagement publish more and grow less, and the team cannot work out why for two quarters.
What we recommend
At Rock we run social plans inside the same workspace where the marketing team works. The plan lives as a pinned note in the marketing space. The pillars and audience personas live as separate notes the team re-reads quarterly. The editorial calendar is a board where each card is a post in production. Replies and inbound DMs live in chat next to the post, not in a separate inbox tab.
Replies and inbound DMs live in chat next to the post, not in a separate inbox tab.
For agencies running social on retainer, the plan structure is reusable across clients. The six sections, the production pipeline, the community management rules, the KPI framework, the pitfalls list are the same. Only the audience definition, the specific pillars, and the platform mix change per client. Build the social plan template once, then duplicate the space per client. The compounding gain across a portfolio comes from this reuse, not from any single tactic.
Three adjacent disciplines tie the social plan into the broader operating model. Marketing operations runs the day-to-day execution. Capacity planning tells you how much social work the team can carry without quality dropping; social is one of the easiest channels to over-promise on and under-deliver. Agency KPIs close the loop on the operating side.
The broader marketing system fits together cleanly. The pillar marketing plan sits upstream as the artifact this social plan inherits its goals from. The content marketing plan handles the wider content system that social distribution sits inside. Campaign management handles the one-campaign-at-a-time view when a social push needs paid or content support. Each piece does one job; the plan is what connects them.
How to start your social plan this quarter
If your current social activity is unplanned (most teams are), do not try to write a perfect 12-month plan. Run a 90-day plan against the framework above and use the retrospective at day 90 to plan the next quarter. The first 90 days are about getting the system working, not winning every channel.
Three moves to start this week. Pick the channels: two or three platforms where the audience actually is, no more. Set the cadence honestly: a frequency the team can hold past month two, not the aspirational version. Set the community-management rules: response time targets, brand voice doc, escalation path. The other sections fill in over the first 30 days.
Run the social plan inside the same workspace as the work. Rock combines chat, tasks, and notes in one workspace. One flat price, unlimited users. Get started for free.
A content marketing plan is the content-specific layer of your broader marketing plan. Most teams confuse it with a content calendar; the calendar is the production schedule that comes out the other end. The plan says who you are writing for, what you are writing about, and how the work moves from idea to published to measured.
This guide covers what goes into a content marketing plan and how to define content pillars that ladder up to your audience. It walks through the production pipeline so the calendar does not slip every month, and where the plan should live so it survives the first quarter. Read on if your team is shipping pieces but cannot tell you whether they are compounding.
The plan is not a content calendar; it is the document that says who, what, why, where, and how before the calendar gets built.
What is a content marketing plan?
A content marketing plan is the document that says who your content is for, what you will publish, where it will live, and who owns each piece. It sits inside your broader marketing plan and inherits its goals. The plan is not a content calendar, though it produces one; it is not a strategy document, though it inherits from one. It is the operational layer between strategy and production.
A good plan answers six questions. Who exactly is the audience and what do they care about? What content pillars will we own this year? What formats will we ship in each pillar? Where will we publish and how will we distribute? Who owns each step from brief to publish to measure? How will we know whether any of this worked?
"Nobody cares about your products or services. Why you exist is not your product. Your why is the problem your product solves." - Joe Pulizzi, founder of Content Marketing Institute
Pulizzi's frame is the cleanest test for whether a plan starts in the right place. If the first three pages of your plan are about your products, the plan will read as marketing collateral and the audience will treat it that way. If they are about the problem the audience is trying to solve, the plan has a chance.
What goes in a content marketing plan
The plan is shorter than most teams expect. Five to seven sections, each one tight enough that the team will actually re-read it. The structure below works for in-house marketing teams, agencies running content for clients, and founders writing the brand themselves.
Section
What it answers
Common mistake
Audience and segments
Who exactly are we writing for, and what do they care about?
Generic personas like "B2B decision makers" produce generic content
Content pillars
What three or four big themes will we own this year?
Random topic lists with no compounding effect
Format mix
What forms does the content take inside each pillar?
Picking formats before pillars; channels before audience
Editorial calendar
When does each piece ship, and around what milestones?
Calendar built around the team's spare hours, not the audience cadence
Production pipeline
How does each piece move from brief to published?
Briefs that are too vague, no named owner per step
Distribution and repurposing
Where does the content go after it ships, and how is it reused?
Treating distribution as a residual, not a budgeted layer
Measurement
How do we know whether any of this is working?
Measuring everything the analytics tool shows, not what changes the next plan
Define your audience and content pillars
The audience comes first. Two or three personas, written in enough detail that a new writer could pick up the document and write to the right reader without asking. The mistake teams make is treating personas as a stock taxonomy exercise; the personas that work for content are operational, not theoretical. They name the job, the pain, the trigger, and the channel where the audience pays attention.
Three or four content pillars turn a list of topics into a system that compounds.
Once the audience is named, content pillars are the structural choice that compounds the rest of the plan. Three or four pillars, each one mapped to a stage of the audience's journey. The four pillars below are a worked example for a B2B agency planning its own brand content; the same structure applies to in-house marketing teams.
Pillar
Audience need it answers
Format mix
Cadence
Educate
Help readers understand a problem they barely know how to name
Long-form blog, explainer video, glossary entries
2 to 4 pieces per month
Decide
Help readers compare options and make a confident choice
Show readers other people like them got the outcome they want
Case studies, customer interviews, social proof posts
1 piece per month
The pillar structure is what turns a list of topics into a system. Each pillar has a job, a format mix, and a publishing cadence. Topics inherit from pillars; pillars inherit from audience needs; audience needs inherit from the strategy upstream. Nielsen Norman Group's content strategy framework makes the same case from a UX angle: strategy informs structure, structure informs content, content informs the user experience. Skip the structural layer and the plan defaults to whichever topic the loudest team member liked that week.
Free resource: download our marketing plan template to get the strategy notes, annual roadmap, and execution board structure ready to copy into your workspace.
Build the calendar and production pipeline
The editorial calendar is the schedule of what ships when. The production pipeline is the workflow that gets each piece from brief to published. Most teams confuse the two; a calendar without a pipeline is wishful thinking, and a pipeline without a calendar is improvisation.
The calendar is the schedule of what ships when. The pipeline is the workflow that gets each piece there.
The seven-step pipeline below is the canonical sequence. Skip a step and the work shows it. Most teams drop step 6 (distribute) and step 7 (measure) because they have no client-visible deliverable. The cost shows up three months later when the team is publishing more and growing less.
BriefA request becomes a defined piece of work. Topic, audience, format, target keyword, length, owner, deadline, success metric. The brief is where the plan meets the work; if a brief is vague, every step downstream costs more. Most production problems trace back to a brief that should have been rewritten.
DraftThe writer turns the brief into a first draft. Inside an agency, this often happens in parallel across several pieces; capacity is the constraint, not creativity. The draft step is also where research happens. Skip the research and the editing step turns into ghost-writing.
EditA second pair of eyes runs the draft against the brief, the brand voice, and the structural checks. An edit is not a polish; it is a structural review. Editors are the cheapest insurance against work that ships and quietly underperforms because the brief got watered down somewhere between request and publish.
ApproveFinal sign-off from the person whose name is on the brief. For agency work, this is the client. For internal content, this is the marketing lead. Long approval cycles are the single biggest cause of slipping editorial calendars; a 24-hour approval window built into the brief saves more time than any production tool.
PublishThe piece goes live. Format-specific work happens here: SEO checks for blog posts, design QA for visual content, technical review for video. Publish is a checklist, not a creative strategy step; treat it like one and the team stops re-litigating decisions made in step 1.
DistributePush the piece into the channels where the audience pays attention. Email, social, paid amplification, syndication, internal sales enablement. Most teams ship and forget; the discipline of distribution is what turns one piece into ten touchpoints. Distribution is part of production, not a separate workflow.
Measure and iteratePull the numbers from the success metric named in the brief. Compare against target, document what worked and what did not, feed the learnings back into the next brief. Most teams skip this step and the same mistakes repeat for two years. The retro is what turns the production line into a learning system.
"Content marketing is resilient and effective, but not easy. Producing and promoting content is a big job and a long-term commitment." - Andy Crestodina, co-founder of Orbit Media
Crestodina's annual blogger survey is the single best dataset on what content production actually costs. The 12th edition found the average article runs 1,333 words and takes around 3.5 hours to write. Multiply that out across the calendar and the staffing math gets honest fast; most teams plan a calendar that requires twice the production hours they have. Capacity planning is the corrective.
The production pipeline lives inside whatever workspace the team uses every day. Briefs as notes, drafts as task cards, edits as comments, approvals as task transitions, publish as a checklist. Run it as a project, not a doc. RACI is useful for assigning ownership at each step. Kanban is the natural board format for a production line where multiple pieces are at different stages.
Distribute, repurpose, syndicate
Most content plans budget for production and treat distribution as a residual. The compounding gain comes from the opposite split: production gets you the asset, distribution gets you the audience. A 2,000-word article that ships and gets one tweet is content production, not content marketing.
Channel
Job in the plan
Cadence
Owner
Organic search
Compounding pull, long lifespan
Always-on, 2 to 4 pieces per month
SEO and content lead
Email newsletter
Direct relationship with the audience you already have
Weekly or bi-weekly
Content lead
LinkedIn
Professional reach, decision-maker visibility
3 to 5 posts per week per author
Founder, executive team, plus content lead
Industry communities
Trusted voices in spaces buyers already trust
Active participation, not posting
Subject-matter expert
Syndication and guest posts
Borrowed authority, link acquisition
1 to 2 placements per quarter
Content lead with PR or partnerships
Paid amplification
Reach the long tail of the audience the algorithm hides
Per-campaign, behind the best-performing pieces
Paid lead
Sales enablement
Turn content into deals by arming the sales team
Per-campaign and per-piece on flagship content
Content lead with sales
The distribution table above is the channel layer. Each piece in the calendar should hit at least three channels in the first 72 hours after publish, and one or two long-tail channels in the weeks after. Repurposing extends the same piece across formats: a long article becomes three LinkedIn posts, an email, a sales-enablement deck, and a snippet for the next podcast.
Distribution channels are also where the content plan meets the rest of marketing. For the umbrella plan that ties content into SEO, social, email, and paid, see the digital marketing plan. Platform-specific social distribution sits inside its own social media marketing plan. Search-driven distribution belongs to your SEO marketing plan; campaign-led pushes belong to campaign management. The content plan names the channels and the cadence; the channel-specific plans handle the tactics.
"We all know that any company with a website is a publisher, but only recently have we begun to understand what that really means. It can take us deeper into unmapped territory, to help us flush out the richer story of our businesses, our purpose, our why." - Ann Handley, partner at MarketingProfs and author of Everybody Writes
Handley's framing is what flips the distribution conversation. The plan is not pushing content out to an audience; it is publishing on behalf of an audience that already exists. The shift is small in language and large in practice. Plans that start from broadcast feel like noise; plans that start from publishing build readers.
Measure what matters
Measurement on a content plan should be tight. Three to five numbers, each tied to a pillar or a goal in the broader marketing plan. The marketing funnel guide covers stage-by-stage benchmarks if you want a leak diagnostic. The temptation is to measure everything the analytics tool provides; the discipline is measuring only what changes next quarter's plan.
Tight measurement beats broad measurement. Three to five numbers tied to pillar goals, not the full analytics dashboard.
For the educate pillar, organic traffic and time on page are the leading indicators. For the decide pillar, comparison-page conversions and demo requests. For the apply pillar, template downloads and tutorial completions. For the trust pillar, branded search and direct traffic. Each pillar gets one or two numbers; the dashboard fits on a notecard, and the team actually opens it.
The cadence matters as much as the numbers. A 15-minute weekly check on the leading indicators, a 30-minute monthly readout against the full set, a quarterly retrospective that decides what changes in the next 90 days. Tie the content KPIs back to the broader marketing KPIs; an isolated content dashboard tends to underweight itself in the broader business conversation.
Common pitfalls
The mistakes below show up across content plans that intend to compound and slowly drift back into a publishing schedule with no system underneath. Most are pattern-recognition failures, not analytical ones.
Planning by channel before audienceMost content plans start with a list of channels: blog, LinkedIn, newsletter, podcast. The plan that ranks and converts starts with the audience and the questions they are actually asking. Channels are how you reach them; pillars and topics are why they read. Get the order wrong and the plan turns into a calendar of activity with no compounding effect.
No production ownerBriefs get written, drafts get assigned, edits float around in shared folders, publish dates slip. The fix is one named producer who owns the calendar end to end. Without that role, every step is a negotiation and the calendar is wallpaper. Production accountability is more important than any tool choice.
Agency-brand content losing to client workFor agencies, the cleanest signal that the content plan is broken is when the team is shipping for clients but the agency's own thought leadership has not been updated in three months. The team that writes for clients is the team that writes for the brand; capacity is finite. Bake the brand-content hours into the staffing model or expect the brand calendar to slip every time client work tightens.
No distribution layerA 2,000-word article that ships and gets one tweet is content production, not content marketing. Distribution is part of the plan, not a residual; budget the time for it in the brief, name the channels in the calendar, and assign the owner. The compounding gain comes from distribution discipline, not from publishing more.
Measurement that does not change behaviorReports get pulled, decks get built, the meeting happens, and nothing changes. The fix is naming the success metric in the brief at step one, then writing the retrospective in the same workspace where the next brief gets written. If the measurement does not change next month's plan, the measurement is wallpaper.
The biggest of the five is the third one for agencies, the second for in-house teams. Agency-brand content losing to client work is the single most common reason agencies cannot tell a credible content story about themselves. The fix is not motivation; it is staffing. Bake the brand-content hours into the model or expect the calendar to slip every quarter.
What we recommend
At Rock we run content plans inside the same workspace where the marketing team works. The plan lives as a pinned note in the marketing space. The pillars and audience personas live as separate notes the team re-reads quarterly. The editorial calendar is a board where each card is a piece in production. Distribution checklists live as task templates. Status updates happen in chat next to the work, not in a separate weekly meeting.
The plan, the briefs, and the production board live alongside the chat where status updates happen.
For agencies running content on retainer, the plan structure is reusable across clients. The pillar framework, the production pipeline, the distribution channels, and the measurement structure stay the same. Only the audience definition, the specific pillars, and the topical content change per client. Build the content plan template once, then duplicate the space per client. The compounding gain comes from this reuse, not from any single tactic.
Three adjacent disciplines tie the content plan into the broader operating model. Marketing operations runs the day-to-day execution layer underneath the plan. Billable hours ties the plan to the financial side; agency-brand content that runs over its allocated hours quietly is the most common source of margin erosion. Agency KPIs close the loop on the operating side, sitting underneath the per-client content KPIs.
The Content Marketing Institute's 2026 B2B Content and Marketing Trends Report surveyed more than 1,000 B2B marketers. It found that documented strategy is one of the strongest predictors of perceived content effectiveness. Most teams know they need a plan; the gap is between knowing and writing it down.
How to start your content plan this quarter
If your current content output is unplanned (most teams), do not try to write a perfect 12-month plan in the first week. Run a 90-day plan against the framework above and use the retrospective at day 90 to plan the next quarter. The first 90 days are about getting the system working, not winning every pillar.
Three moves to start this week. Define the audience: two personas at most, written tight enough that the team can say no to the wrong topics. Pick the pillars: three or four themes, each tied to an audience need, with a format mix and cadence. Set the production pipeline: brief, draft, edit, approve, publish, distribute, measure, with a named owner at each step. The other sections fill in over the first 30 days.
Run the content plan inside the same workspace as the work. Rock combines chat, tasks, and notes in one workspace. One flat price, unlimited users. Get started for free.
An SEO marketing plan is the SEO-specific layer of your broader marketing plan. Most SEO plans fail in the same predictable way: they are built around tactics (write blogs, build links) without a measurable goal in front of them. Three months later the team has shipped activity but cannot tell you whether anything moved.
This guide covers what an SEO marketing plan actually is and the 90-day framework that gets one out of the document and into the work. It walks through the keyword research that ladders to a publishing priority and the KPIs that tell you if the plan is working. It also covers where the plan should live so it does not die in a Google Doc by month two. Read on if your team is ready to run SEO as a project, not a tactic list.
Most SEO plans fail in the same way: built around tactics, not measurable goals.
What is an SEO marketing plan?
An SEO marketing plan is a 90-day to annual document that says what your team will do to grow organic search traffic. It covers four components: keyword and topic research, content production, technical site health, and link acquisition. The plan sits inside your broader marketing plan, inherits its goals, and assigns each piece of work to a named owner. It is the execution layer, not the strategy itself.
The function is often confused with SEO strategy. Strategy answers why a search audience should pick you and how you will win their queries. The plan answers what the team will do this quarter, when, and by whom. Most teams treat them as the same thing, which is why most SEO plans drift away from the strategy in month two.
"An SEO strategy defines how to overcome critical challenges by leveraging competitive advantages." - Kevin Indig, Organic Growth Advisor
Indig's framing is the cleanest test. If your plan does not name the critical challenge or the competitive advantage, you have a tactical to-do list, not a plan. The 90-day framework below assumes the strategy work has been done; if it has not, do that first.
The 90-day SEO marketing plan
The 90-day frame is the smallest unit of time in which an SEO plan can show meaningful results. Anything shorter is a sprint; anything longer drifts. Six steps, in roughly two-week blocks, take you from baseline to first measurable outcome.
Days 1 to 14: Audit and baselinePull the current numbers before changing anything. Index coverage from Google Search Console, top 50 ranking pages and queries, technical health (Core Web Vitals, crawl errors, broken internal links), and the inbound link profile. The audit produces a one-page baseline. Without it, the plan has nothing to measure against three months later.
Days 15 to 30: Keyword research and topic clustersBuild the keyword inventory the plan will execute against. Group keywords by intent (informational, commercial, transactional) and topic cluster. Map each cluster to a target page: hub article, supporting articles, or a redirect for cannibalization risk. The output is a publishing priority list, not a 2,000-row spreadsheet that nobody reads.
Days 31 to 45: Content gaps and editorial planIdentify what competitors rank for that you do not. Pull competitor URLs ranking in the top 10 for your priority clusters, score each gap by traffic potential and difficulty, and turn the top 8 to 12 gaps into briefs. Each brief names the target keyword cluster, the sibling links, and the owner. Briefs are the bridge between research and shipped pages.
Days 46 to 60: Technical fixes and on-page workIn parallel with content production, ship the technical work the audit surfaced. Crawl errors, redirect chains, page speed, schema markup, internal linking. Most agencies underweight this step because it has no client-visible deliverable; the plan should explicitly budget time for it. Technical health is the floor; without it, content gains stay capped.
Days 61 to 75: Publish and link buildShip the content briefs from week 4 to 5. Two to four pieces per week is realistic for a small team; faster is usually a sign that someone cut corners on the brief. In the same window, identify 8 to 12 link prospects per published cluster and run the outreach. Link building without published content underneath it does not compound.
Days 76 to 90: Measure, report, iteratePull the same numbers from week 1 and compare. Index coverage, top queries, pages ranking 5 to 20 (the easiest gains live here), and inbound link velocity. The 90-day report is not a status update; it is a planning input for the next quarter. Most plans skip this loop and the second quarter reverts to improvisation.
The 90-day frame is the smallest unit in which an SEO plan can show meaningful results.
Two cautions on the 90 days. First, the dates are guidance, not contracts: a slow audit should not be the reason content production starts late. Run the steps in parallel where the team allows. Second, the loop is not done at day 90; the report at the end is a planning input for the next quarter, not a closing slide. Run it as a project, not a doc, and the second quarter compounds on the first.
Keyword research that ladders to a plan
Most keyword research dies as a 2,000-row spreadsheet that nobody reads. The plan that ships is built around topic clusters mapped to specific pages, not a long list of single keywords. The trick is grouping keywords by intent, scoring each group by difficulty and traffic potential, and turning each group into a target page.
Keyword group
Intent
KD range
Planned page
Brand defense
Navigational
0 to 10
Homepage and product pages, plus a glossary entry
Head-term explainers
Informational
30 to 60
Hub article, 2,000 to 3,000 words
Long-tail how-to
Informational
10 to 30
Supporting articles in the cluster, 1,500 to 2,000 words
Comparison and alternatives
Commercial
20 to 50
Head-to-head and listicle pages
Templates and checklists
Transactional
20 to 45
Template pages with downloadable assets
Pricing and buy-now
Transactional
40 to 70
Pricing and product pages with strong CTAs
The table above is a starter mapping; the specific groups depend on your category and audience. The point is the structure: every keyword in the inventory belongs to a group, every group is mapped to a page, and the publishing priority is set by traffic potential against keyword difficulty. A spreadsheet that lacks this mapping is research, not a plan.
"SEO strategy is not the same as tactics. The strategy is what you do at a high level; tactics are the specific steps." - Aleyda Solís, Founder, Orainti
Solís makes the distinction the SERP regularly fails to. The plan operates at the tactics layer; it inherits the strategic choices from upstream and turns them into the work that ships. Keyword research is the bridge between the two. Without it, the plan defaults to whatever the loudest team member googled that week.
Content gap analysis
Content gap analysis answers a single question: what do competitors rank for that you do not? The output is a prioritized list of pages to build. The most common mistake is treating it as a brainstorm rather than a structured comparison; the second is producing a 200-row gap list and never publishing against it.
Competitor topic
Volume / month
Their angle
Your gap and page idea
Annual marketing planning
1,000
Generic in-house planning guide
Agency-flavored multi-client planning hub with retainer scope
Marketing budget template
2,400
Excel template, no narrative
Hybrid guide and downloadable budget worked example
Marketing operations framework
800
Enterprise martech-heavy
Lean ops framework for 5 to 50-person teams
Quarterly business review
1,600
Sales QBR, not marketing
Marketing QBR template tied to client retainer reporting
The four-column structure above is the minimum useful version. Pull the top 10 ranking URLs for each priority cluster, score the gap by traffic potential and difficulty, and turn the top 8 to 12 gaps into briefs. Briefs are the bridge between research and shipped pages; without them, the plan becomes a vague writing schedule. For the broader digital integration layer that ties SEO into social, content, email, and paid, see the digital marketing plan. The wider editorial system around those briefs lives in your content marketing plan, and the platform-specific social cadence and community work sits inside a social media marketing plan.
Gap analysis turns competitor wins into a prioritized list of pages to build.
For agencies running this for client retainers, the gap analysis is also the cleanest selling artifact: it shows the client where they are losing share and gives a concrete plan for closing it. Campaign management handles the production side once the briefs are written.
Measurement and reporting cadence
The plan is only as good as the report it produces. Measure the wrong things and the team improves the wrong things; measure on the wrong cadence and the team optimizes for noise. Split the KPIs into leading indicators (early signals you watch weekly) and lagging indicators (outcomes you report monthly to stakeholders).
KPI
Type
Source
Cadence
Indexed pages
Leading
Google Search Console
Weekly
Pages ranking 5 to 20
Leading
Search Console + rank tracker
Weekly
Click-through rate by query
Leading
Search Console
Monthly
Inbound link velocity
Leading
Backlink tool of choice
Monthly
Organic sessions
Lagging
GA4
Monthly
Organic conversions
Lagging
GA4 plus CRM
Monthly
Brand search volume
Lagging
Search Console
Quarterly
The leading indicators are where the plan gets adjusted; the lagging indicators are where the plan is judged. According to the Backlinko organic CTR study, the first Google result earns roughly a 27.6 percent click-through rate, around ten times the click-through of the tenth result. For the broader funnel diagnostic of where SEO traffic converts (and leaks), see the marketing funnel guide. Pages ranking 5 to 20 are where the easiest gains live; pull this segment from Search Console weekly and prioritize the on-page work that moves them up.
The cadence matters as much as the numbers. A 15-minute weekly status check on the leading indicators, a 30-minute monthly readout against the full KPI table, a 60-minute quarterly retrospective that decides what changes in the next 90 days. Tie the SEO KPIs back to your overall marketing KPIs that actually matter; an SEO plan disconnected from broader marketing measurement quietly underweights itself.
Common pitfalls
The mistakes below show up across SEO plans that intend to ship and slowly drift back into improvisation. Most are pattern-recognition failures, not analytical ones.
Picking keywords by volume aloneHigh-volume head terms look exciting on a slide. They also tend to be the hardest to rank for, with intent that is muddy or commercial-only. The plan that ranks is built around clusters where the topic, the volume, and the intent all line up. Volume without intent is vanity; intent without volume is busywork.
No reporting cadence baked into the planAn SEO plan that is not reviewed monthly is improvisation with extra steps. Set the cadence before you sign off: a 15-minute weekly status check, a monthly readout against the KPI table, a quarterly retrospective that decides what changes in the next 90 days. Without it, the plan is a deck nobody opens.
Treating it as a doc, not a projectSEO plans get written in Google Docs and then orphaned from where the work happens. Briefs live in one tool, tasks in another, links in a spreadsheet, the report somewhere else. The compounding gain comes from running it as one project with one source of truth, not from any single tactic.
Skipping the technical baselineTechnical work has no client-visible deliverable, so it gets cut first when the calendar tightens. Three months later the new content cannot rank because the underlying site is slow, broken, or thin on internal linking. The fix is to budget technical hours explicitly in the plan, not to leave them as the residual after content.
Ignoring brand searchBrand-search volume is the cleanest leading indicator of whether the SEO plan is doing its job. People who know about you Google your name. Most plans never measure it because it is not in the standard SEO tool dashboard. Pull it from Search Console quarterly and watch it climb; if it does not, the rest of the plan is not landing.
The biggest of the five is the second one. SEO plans without a review cadence have a half-life of about 90 days; after that the team is improvising and the plan is wallpaper. Setting the cadence (weekly check, monthly readout, quarterly retro) before the plan is signed off is what turns the document into a working artifact.
What we recommend
At Rock we run SEO plans inside the same workspace where the marketing team works. The plan lives as a pinned note in the marketing space; the keyword inventory and gap analysis live as linked sheets in Files; the briefs live as task cards on the production board. Status updates happen in chat next to the work, not in a separate weekly meeting that everyone half-attends. One workspace, one source of truth.
The plan, the briefs, and the production board live in one workspace alongside the chat.
For agencies running SEO on retainer, the plan structure has one extra layer: it is reusable across clients. The 90-day framework, the KPI table, the gap analysis structure, and the pitfalls list are the same; only the keyword inventory and content briefs change per client. Build the SEO plan template once, then duplicate the space per client. The compounding gain across a portfolio of retainers comes from this reuse, not from any single tactic.
The retainer-specific pieces that the in-house lens misses sit in three adjacent disciplines. Capacity planning tells you how many SEO retainers your team can serve without quality dropping. Billable hours ties the plan to the financial side; an SEO plan that runs over its retainer hours quietly is the most common cause of margin erosion in agency work. Agency KPIs close the loop on the operating side, sitting underneath the per-client SEO KPIs.
"Search is a behavior, not a channel." - Rand Fishkin, SparkToro
Fishkin's framing is increasingly important as search splits across surfaces. The SparkToro and Datos State of Search research found Google still commands roughly 73.7 percent of desktop searches across 41 analyzed sites, but AI tools and other surfaces are taking measurable share. The plan should account for this; building only for Google ranking is a 2024 SEO plan, not a 2026 one.
Pair the SEO plan with the broader operating system and the discipline compounds. Marketing operations runs the day-to-day execution. The pillar marketing plan sits upstream as the artifact this SEO plan inherits its goals from. Campaign management handles the one-campaign-at-a-time view when an SEO push needs paid or social support.
Free resource: download our marketing plan template to get the strategy, roadmap, and execution board structure ready to copy into your workspace.
How to start your SEO plan this quarter
If your current SEO is unplanned (most teams), do not try to write a perfect 12-month plan in the first week. Run a 90-day plan against the framework above, and use the retrospective at day 90 to plan the next quarter. The first 90 days are about getting the system working, not winning every cluster.
Three moves to start this week. Pull the audit baseline (index coverage, top ranking pages, technical health, link profile) from Google Search Console and store it where the team can see it. Pick three priority keyword clusters from your existing list and turn them into briefs; if you do not have a list, run the keyword research step first. Schedule the cadence on the calendar before you sign off on the plan: weekly status, monthly readout, quarterly retro. Without the cadence, none of this matters.
Run the SEO plan inside the same workspace as the work. Rock combines chat, tasks, and notes in one workspace. One flat price, unlimited users. Get started for free.
Most marketing plans get opened twice: once at kickoff and once at the quarterly business review. The rest of the year the plan sits in a shared drive, while the team improvises against whatever the inbox demands that week. This is not a planning problem. It is a working-document problem.
This guide covers what a marketing plan actually is, the seven sections every good one needs, and the seven-step process for writing one. It also walks through the three layers (annual, quarterly, monthly) that keep the plan alive past kickoff. Run the completeness check below first to see which sections of your current plan are ready and which still need work.
Marketing Plan Completeness Check
Tick every section your current plan has documented. Eight checks, one minute. Score below shows which sections are ready and which still need work.
0% completeNot started
Tick the items above to see where your plan sits.
0 of 8 sections checked
Most plans are 50 to 70 percent complete. The two sections most often missing: measurable KPIs and a defined review cadence.Try Rock for free
What is a marketing plan?
A marketing plan is a written document that says what a business will do to reach its marketing objectives, when, and by whom. It translates a marketing strategy into concrete work that gets shipped. The pieces are target audiences, goals with numbers, channel mix, budget, calendar, and named owners. A plan without those pieces is a wishlist; a plan with all of them but no review cadence is a binder.
The function is often confused with two adjacent disciplines. Strategy sits upstream of the plan and answers why the audience should pick this brand. Marketing operations sits underneath the plan and runs the work day to day. The plan itself is the artifact in the middle: the document that turns a strategy into the specific work the team ships this year.
Dimension
Marketing Strategy
Marketing Plan
Marketing Operations
What it is
The choice of where to play and how to win
The document that says what to do, when, and by whom
The system that runs the work day to day
Question it answers
Why should this audience pick us?
What will we do this year to win them?
How does this team ship the work without chaos?
Time horizon
Multi-year
Annual, with quarterly and monthly layers
Daily and weekly
Output
Positioning, segmentation, value prop
Goals, channels, budget, KPIs, owners, calendar
SOPs, capacity plans, retainer rhythm
Owner
CMO or agency partner
Marketing lead or account director
Operations lead
Lives in
Strategy doc, refreshed annually
Working document, updated monthly
The team workspace, every day
"A marketing plan is a written document that summarizes what the marketer has learned about the marketplace and indicates how the firm plans to reach its marketing objectives." - Philip Kotler, Principles of Marketing
Kotler's definition is the textbook one for a reason. The two halves matter equally: the diagnosis of what the marketer has learned, and the explicit how-we-will-reach. A document with only the second half is a tactical to-do list; a document with only the first is a research deck. Both are common; neither is a marketing plan.
The 7 sections every marketing plan needs
Strong plans are not long. They are complete on the seven sections below, each one short enough to be read in a meeting. The table summarises the structure, what each section answers, and the mistake most plans make at that step.
Section
What it answers
Common mistake
1. Situation analysis
What is happening in the market and our share of it?
SWOT slide that no one updates after Q1
2. Audience and segments
Who exactly are we trying to reach?
"Everyone with a budget" passes for a segment
3. Positioning and message
Why should this audience pick us?
Inside-out copy that names features, not outcomes
4. Goals and KPIs
What does success look like, with numbers?
Vanity metrics: impressions, followers, traffic
5. Channel mix and tactics
How do we reach the audience and convert them?
Doing every channel because the team has heard of all of them
6. Budget and capacity
What is this going to cost, in money and hours?
Budget without capacity, or capacity without budget
7. Calendar and owners
When does each thing happen, and who is responsible?
Calendar with no owners; owners with no calendar
The most common failure is treating goals and KPIs as the same thing. The goal is the outcome the business wants, like growing qualified pipeline by 25 percent. For the diagnostic lens that maps which stage of the buyer journey is leaking, see the marketing funnel guide. The KPI is the number the team watches to know if the goal is on track, like marketing-qualified leads per channel per month. Lump them together and the plan loses its measurement layer. Our deep dive on marketing KPIs covers which numbers matter and which are vanity.
Strong plans are not long; they are complete on the seven sections, each short enough to read in a meeting.
How to write a marketing plan in 7 steps
The seven steps below are the canonical sequence, and the order matters. Skipping the audience step turns goal-setting into guesswork. Jumping to channels before goals turns the plan into a tactics list with no judge for whether the tactics are right.
Analyze the situationLook honestly at the market, the competition, and where the brand sits today. A SWOT or PESTEL is fine if it produces a real read; a SWOT slide that lists generic strengths and threats is filler. The output is a one-paragraph diagnosis a stranger could read and understand the business.
Define the audiencePick the segments worth winning and describe them in enough detail that the team knows when to say no. "Mid-market B2B SaaS marketing leaders, 200 to 1000 employees, replacing a legacy stack" beats "B2B decision makers." Most weak plans skip this step and try to talk to everyone.
Set the goalsThree to five SMART goals at most. Tie each to a number, a deadline, and a baseline. Generic goals like "grow brand awareness" do not survive contact with a budget conversation; "lift brand-search volume from 2,400 to 4,000 per month by Q4" does.
Choose the channel mixPick the two or three channels where the audience actually pays attention. Add a fourth as an experiment. Plans that list eight channels at 12 percent each are wishlist plans. Concentration beats breadth at 5 to 50-person scale.
Allocate the budgetSplit the budget by channel with a contingency line of at least 10 percent. Match it to capacity in hours, not just dollars. A plan that funds a channel the team has no capacity to run is a plan that will be quietly missed by month three.
Build the calendarLay the work out across the year with one named owner per workstream. The calendar lives in the same workspace as the work; if it lives in a doc nobody opens, the plan dies in the second month. Quarterly milestones, monthly check-ins, weekly status.
Define the review cadenceSet the review rhythm before the plan is signed off, not after. Weekly status check, monthly readout, quarterly retrospective. The cadence is what turns a plan into a working document. Plans without a defined cadence end up in the binder.
"Start with diagnosis. Then make choices. And remember to ignore the tactics while the strategy decisions are being made." - Mark Ritson, Marketing Week
Ritson's three-phase frame (diagnose, then choose, then plan tactics) is the cleanest discipline for getting through the seven steps without short-circuiting. Most weak plans short-circuit at step three (goals) by jumping to step four (channels) before the goals are clear. The cost shows up in month four, when the team is shipping channels nobody can connect to a goal.
The plan, the tasks, and the KPIs live in the same workspace; that is what keeps the team aligned past the kickoff.
Marketing plan example
The example below is a small B2B agency running a year of marketing for a mid-market SaaS client. The point of the worked example is not the specific numbers; it is to show how each section connects to the next.
Situation analysis. The client is a mid-market HR-tech SaaS, $8M ARR, 110 employees, growing 15 percent year over year. SERP and ad spend are dominated by three larger competitors. Brand search volume is 2,400 per month and flat. Content output is sporadic; the marketing function is one in-house generalist plus the agency on retainer.
Audience. Two segments. Segment A: HR leaders at 200 to 1,000-employee companies replacing legacy HRIS, willing to consider a smaller vendor for better support. Segment B: People-ops practitioners (the buyer-influencer) who use peer communities and tactical content. Segment A is the buyer; segment B influences the shortlist.
Goals. Three SMART goals. Lift brand-search volume from 2,400 to 4,000 per month by Q4. Generate 480 marketing-qualified leads (40 per month average) with 12 percent of those becoming sales-qualified opportunities. Close $1.6M in net new ARR with marketing-attributed pipeline.
Channel mix. Three channels at meaningful spend. SEO and content (45 percent of budget): topical authority on three clusters that match buyer pain. Paid search (30 percent): defensive on brand plus selective non-brand on three head terms. Industry community and events (20 percent): two practitioner communities, four virtual events, two in-person events. The remaining 5 percent is contingency.
Budget and capacity. $360K annual budget. Capacity in agency hours: 80 hours per month from the agency, 25 percent of one in-house FTE. The plan is reviewed against capacity before sign-off; one of the planned content clusters is descoped because the team cannot ship at the planned cadence.
Calendar. Quarterly milestones for each channel. Q1 launches the topical authority push and brand defence. Q2 layers community and the first in-person event. Q3 expands non-brand paid and runs the second event. Q4 protects pipeline through year-end and prepares the renewal push. Owners are named for each workstream, with a weekly status check, monthly readout, and quarterly retrospective.
The plan is two pages plus an appendix. It lives in the same workspace as the work; the team opens it weekly, not annually.
Annual, quarterly, monthly: the three layers
One document does not solve the working-document problem. The annual roadmap moves too slowly to guide weekly decisions; the monthly task list moves too fast to hold the strategic line. Strong agencies run all three layers as one family, not as separate artifacts that drift apart.
Annual, quarterly, and monthly layers run as one family. The same definitions cascade through each.
Layer
Annual roadmap
Quarterly campaign plan
Monthly retainer plan
Time horizon
12 months
1 quarter
1 month
What it sets
Goals, segments, budget, channel mix
Campaigns, themes, milestones
Deliverables, owners, weekly cadence
Audience
Leadership and finance
Marketing team and account leads
Production team and the client
Updated
Annually, soft refresh quarterly
At quarter open and close
Every Monday
Format
Slide deck or doc
Plan note plus task board
Task list with deadlines
Key risk if missed
Plan drifts from strategy
Campaigns slip or compete with each other
Retainer scope creeps quietly
The trick that makes the three layers work is using the same definitions across them. The annual roadmap names the audience, the goals, and the channel mix. The quarterly campaign plan inherits those and adds specific campaigns and milestones. The monthly retainer plan inherits those and adds specific deliverables and owners. If the quarterly plan invents a new goal that does not appear in the annual roadmap, that is the signal the strategy has drifted.
Eisenhower's point applies directly. The plan as a document is worth almost nothing once execution starts. The discipline of planning, the conversations and tradeoffs that produce it, gives the team a shared mental model when reality changes. The three-layer structure is what keeps the planning alive past the document.
Channel-specific plans (when to spin them out)
The seven sections cover a marketing plan at the level of the whole function. When a channel is large enough or technical enough to deserve its own document, that document inherits from the main plan and goes deep on the channel-specific tradeoffs.
SEO marketing plan. When SEO is more than 20 percent of the budget or the business depends on organic search, write a dedicated SEO marketing plan. It covers keyword strategy, content gap analysis, technical health, link acquisition, and the measurement layer that ladders up to the main plan.
Content marketing plan. When content is the engine that feeds multiple channels (SEO, social, sales enablement), a separate content marketing plan handles the editorial calendar, production pipeline, distribution, and repurposing. Without it, content gets briefed on a project-by-project basis and the cumulative compounding effect is lost.
Social media marketing plan. When social is a primary channel for either reach or community, a social media marketing plan covers content pillars, posting cadence, community management, and platform-specific reality. The big mistake is treating social as one channel when in practice each platform is its own.
Other channels (paid search, email, partnerships, events) follow the same logic. If your plan covers multiple digital channels and you need the layer above them all, the digital marketing plan guide covers the integration logic. Spin out a dedicated plan when the channel is structurally distinct or large enough that the main plan cannot do it justice.
What we recommend
At Rock we run marketing teams inside the same workspace where the work happens. The annual roadmap lives as a pinned note in the marketing space. The quarterly campaign plan is a board where each campaign is a card with owner, dates, and links to the brief. The monthly retainer plan is a task list with weekly review check-ins on the calendar. One workspace, three layers, no rebuilding the file every Monday.
Pinned plans inside the working space stay alive past kickoff; plans in shared drives quietly die in month two.
This is honest about what Rock does and does not do. Rock is the place the plan lives and gets used; it is not a strategy-generation tool. The strategy work happens upstream in conversations and decision frameworks like SWOT, Porter's Five Forces, and the Strategic Choice Cascade. The plan is what comes out the other end.
Once the plan is written, the next move is keeping it alive. The annual roadmap, the quarterly campaign plan, and the monthly retainer plan all need a home that the team opens daily, not the shared drive that nobody opens at all. That is the difference between a plan that compounds and a plan that decorates.
Free resource: download our marketing plan template to get the strategy notes, annual roadmap, and task board structure ready to copy into your workspace.
Common pitfalls
The mistakes below show up across teams that intend to build a real plan and slowly drift into improvisation. Most are pattern recognition failures, not analytical ones.
Confusing the plan with the strategyA plan without a strategy is a list of tactics. If the document jumps straight into channels and campaigns without naming the audience and the position, the team is doing tactics with no judge for whether they are right. Strategy first; the plan picks up after.
A plan with no review cadenceThe plan is signed off, the binder closes, and nothing is scheduled to revisit it. Three months later the team is improvising. The fix is simple: a recurring weekly check, a monthly readout, a quarterly retro, scheduled before the plan is approved. Cadence is what keeps the plan alive.
Goals without a baseline or owner"Grow leads by 20 percent" without a starting number, a deadline, or a named owner is not a goal. It is a wish. Every goal needs a baseline (where we are today), a target (where we want to be), a deadline, and one person whose name is next to it.
Eight channels at 12 percent eachA plan that funds eight channels at the same level is a plan with no opinion. At 5 to 50-person scale, two or three channels at meaningful spend beat eight channels at token spend every time. Concentration beats breadth; pick the channels where the audience actually is.
One document for everyoneThe client-facing plan and the internal working plan are not the same artifact. The client plan shows outcomes and milestones; the internal plan shows tasks, owners, and risk notes the client should not see. Trying to serve both audiences with one document leaves both audiences underserved.
The biggest of the five is the second one. Plans without a review cadence have a half-life of about three months; after that the team is improvising and the plan is wallpaper. Setting the cadence (weekly status, monthly readout, quarterly retro) before the plan is signed off is what turns the document into a working artifact instead of a binder.
The CoSchedule 2022 Trend Report on Marketing Strategy surveyed 515 marketers. Those who proactively plan their marketing were 331 percent more likely to report success than peers; only 17 percent had documented the majority of their strategy. The gap between knowing the plan matters and writing it down is wider than most teams admit.
How to start writing your marketing plan this week
If your current plan is missing two or more of the seven sections from the scorecard at the top, do not try to rebuild the whole document this quarter. The fastest path to a usable plan is to fill the three highest-leverage sections this week and add the rest over the next month.
Start with goals and KPIs. Three SMART goals at most, each with a baseline, a target, a deadline, and a named owner. If the goals already exist but live in someone's head, write them down. The team cannot follow what is not written.
Then nail the audience. One paragraph per segment, specific enough that the team can say no to the wrong work. "Mid-market HR leaders replacing legacy HRIS" beats "B2B decision makers" by a wide margin. Specificity is what makes the plan useful.
Last, set the cadence. Weekly status check, monthly readout, quarterly retro, scheduled before the plan goes to anyone for sign-off. The cadence is what keeps the document alive. Without it, the plan dies in the second month and the team goes back to improvising.
The other four sections matter, but they fill in over the first 30 days. The three above (goals, audience, cadence) are what separate a plan from a wishlist. Once the three are in place, the plan is ready to be used; the rest is detail.
Run the plan inside the same workspace as the work. Rock combines chat, tasks, and notes in one workspace. One flat price, unlimited users. Get started for free.
Most agencies do not lose money on bad work. They lose it on missed handoffs, briefs that arrive without context, reports rebuilt from scratch every month, and the same fire-drill on a different client every Thursday. Marketing operations is the discipline that turns those one-off heroics into a system that runs the same way for every client without the chaos.
This guide covers what marketing operations actually means, the four pillars under it, and how the function looks different in an agency than inside a single brand. It also walks through the operating loop, the maturity model, and where to start if your ops sit between Ad-hoc and Defined. Run the maturity check below first to see where your team lands before reading on.
Strong marketing operations turns one-off heroics into a system that runs every client the same way.
Marketing Ops Maturity Check
Five questions, one minute. Pick the answer that best matches how your team runs today, not how you wish it ran. The result tells you which level your operations sit at and what to fix next.
Level 0: Not started
0 of 5 answered
Most agencies sit between Repeatable and Defined. The jump comes from running the same loop in one shared workspace, not from buying more tools.Try Rock for free
What is marketing operations?
Marketing operations is the system of process, people, technology, and data that runs marketing as a repeatable practice rather than a series of campaigns held together by individual effort. It is the operating model underneath the work: how requests come in, how briefs get written, how production moves, and how the team learns from what shipped. Strong marketing operations make the same machine work twelve times in parallel without twelve sets of fires.
The function is often confused with two adjacent disciplines. Marketing project management covers how a single piece of work moves from brief to delivery. Campaign management covers one campaign end to end across channels. Marketing operations is the meta-layer that contains both, plus the tech, the data, and the team structure.
Dimension
Marketing Operations
Marketing Project Management
Campaign Management
Scope
The full operating model: process, people, tech, data
How a single piece of work moves from brief to delivery
"Marketing ops is the art and science of executing great marketing or bringing a CMO strategy to life." - Darrell Alfonso, author of The Martech Handbook
Alfonso's framing is the cleanest one-liner for the role. Strategy comes from leadership; operations is what turns strategy into shipped work without burning the team out. The art is reading the situation; the science is the repeatable system that runs underneath.
In-house vs. agency marketing operations
Most marketing operations writing assumes a single in-house team running marketing for one company, usually a B2B SaaS shop with a Marketo or HubSpot stack. Agency marketing operations is structurally different in eight ways, and the differences shape every decision about process, hiring, and tooling.
Agency marketing operations runs one loop per client account, in parallel, on shared production capacity.
An in-house team runs one operations loop with multiple campaigns flowing through it. An agency runs one loop per client account, in parallel, with shared production capacity behind them. The center of gravity moves from martech administration toward the production pipeline and the handoffs between strategy, creative strategy, media, and reporting.
The cost discipline is also different. In-house ops measures itself on internal headcount efficiency and software ROI. Agency ops measures itself on billable hours and write-off rate; every operations choice eventually shows up in utilization or margin.
The Gartner 2025 CMO Spend Survey found marketing budgets flatlined at 7.7% of company revenue, with 39% of CMOs planning to cut agency spend. The takeaway for service shops is direct: agencies need leaner, more measurable operations to defend their share of a budget that is no longer growing.
The four pillars of marketing operations
Most frameworks settle on the same four pillars. The labels vary; the substance does not. Each pillar has a different question it answers, a different owner, and a different failure mode when it breaks.
Process. The repeatable workflow that runs from intake to delivery. Brief format, task structure, review cadence, approval flow, retrospective. Process is what separates a Defined-level shop from a Repeatable one. Owner: ops lead or senior PM. Fails when it lives only in one person's head.
People. The team that runs the work and the structure that connects them. Roles, accountabilities, capacity, hiring triggers. People is where most agencies make the wrong call, hiring an ops person to fix what is actually a process gap. Owner: agency owner or partner. Fails when capacity is treated as a spreadsheet exercise rather than a planning discipline.
Technology. The stack that supports the work. Workspace, briefs, production tools, analytics, automation. For agencies this layer should stay deliberately lean; the failure mode is buying tools that promise to fix process problems and end up adding three more logins. Owner: ops lead. Fails when the stack outpaces the process.
Data and measurement. The numbers that tell the team whether the system is working. Operations KPIs (utilization, on-time delivery, write-off rate) plus marketing KPIs that ladder up to client outcomes. Owner: ops lead with finance partnership. Fails when reports are built for show rather than decisions. See our deep dive on marketing KPIs for the full set.
The four pillars (process, people, technology, data) are interdependent; treat them as one system.
The four pillars are interdependent. Better technology without better process produces faster chaos. Better process without measurement produces a system you cannot improve. Better measurement without people accountable to it produces dashboards no one reads. Treat the pillars as one system, not four projects.
The marketing operations team
Inside a 5 to 50-person agency the marketing operations team rarely looks like the org charts you see in B2B SaaS articles. There is no Marketo admin, no demand-gen ops manager, no separate analytics lead. The function is usually one ops lead plus a senior producer, with the rest of the team contributing operations work part-time alongside their delivery role.
A 5 to 50-person agency rarely needs a full ops team; usually one ops lead plus a senior producer.
Ops lead or head of operations. Owns the operating model: process, capacity, measurement, improvement. At smaller shops this is the agency owner or a senior partner; the dedicated hire usually lands around 15 to 20 FTE.
Senior producer or traffic manager. Runs day-to-day flow: intake routing, capacity allocation, schedule defense. The role exists in agencies long before anyone calls it operations.
Project managers or producers. Run individual client accounts or projects. They live inside the operations system but are not responsible for designing it.
Specialist contributors. Senior strategists, finance leads, and tech-savvy team members who own one piece of the operating model (templates, reporting, integrations) without it being their full job.
The hiring trigger most agencies miss is when partners spend more time coordinating internally than working with clients. By that point the team has absorbed a year of bad habits that will take longer to undo than the operating model takes to build. Capacity planning as a discipline tends to surface this signal earlier than gut feel.
"The real maturity gap is not whether you care, or whether your team is talented. It is whether your operating model can function without heroics." - Karl Sakas, Sakas & Company
Sakas's framing is the right test for whether to hire an ops lead. If the agency runs on the founders' nights and weekends, no operating model exists yet; the hire is not the answer until the model is at least sketched. If the team is talented but consistently late or over budget, that is the signal that the model needs an owner.
An operations framework for running marketing
Behind every well-run agency is a repeatable loop that runs whether the work is a one-off project or a monthly retainer. The loop is the same; what changes is the cadence and the depth of each step. For a retainer the loop runs monthly with light planning. For a project it runs once with hard milestones at every step.
IntakeWork enters the system. New retainer scope, ad-hoc client request, internal initiative. The intake step turns the request into a defined unit of work with a brief, an owner, and a deadline. Skipping intake is the most common cause of work that arrives without context and ships late.
Brief and planThe brief gets written or pulled from a template. Strategy, creative, and production align on scope and deliverables. Tasks get broken down, owners assigned, dependencies mapped. For retainers this is light and continuous; for projects it is a hard milestone.
ProductionThe work happens. Copy, design, dev, video, paid setup, content. This is where most billable hours sit and where context-switching across clients quietly destroys utilization. Production runs through tasks, hand-offs, and shared files inside the client workspace.
Internal QABefore anything goes to the client, someone other than the maker reviews it. Brand consistency, factual accuracy, technical checks. This step is what separates Defined-level operations from Repeatable; agencies that skip internal QA send revisions to clients that should never have left the building.
Client review and approvalThe deliverable goes to the client for approval. Comments come back, revisions cycle, the work ships. Speed of approvals is the single biggest variable in retainer profitability and the most under-managed step in agency ops.
Launch and reportThe work goes live. Performance gets measured against the contracted KPIs, not whatever the dashboard tool surfaces by default. The report is a deliverable in itself, with team commentary that explains what the numbers mean for next month.
Retro and improveOnce a quarter, the team walks through what worked, what broke, what slowed the loop down. Notes feed into next quarter's brief template, capacity model, or staffing plan. Operations that skip the retro stay stuck at Defined and never reach Managed.
The seven steps above describe the canonical loop. Most agencies have all of them in some form, but two are routinely skipped or done badly. Internal QA gets cut when timelines tighten, which is exactly when it is most needed. The retro gets cut every quarter for two years and then the team wonders why the same problems keep returning.
For agencies running campaigns inside this loop, the campaign management piece runs as a sub-loop inside steps 2 through 6. For broader project work that touches design, dev, or strategy beyond marketing, marketing project management covers the tactical layer of how the work moves day to day.
Cross-functional handoffs are the hardest part
Most marketing operations failures are handoff failures. Strategy passes a brief to creative; creative passes assets to media; media passes a launch to reporting; reporting closes the loop back to strategy. Every transition is a chance for context to drop and quality to slip.
The numbers on cross-functional collaboration are bleak. Behnam Tabrizi's Harvard Business Review study of 95 teams across 25 corporations found 75% are dysfunctional. They fail on at least three of five measures: budget, schedule, specifications, customer expectations, and goal alignment.
For an agency this is harder still because the handoffs cross client boundaries too. Account management hands off to strategy, strategy to production, production to client review, client review back to account management. A single weak link in that chain produces a missed deadline that the client sees, not just the team. RACI as a discipline helps clarify who is responsible for which transition; without it the handoffs default to whoever shouted last.
"Centralize everything you can. Automate everything you can. Decentralize everything you can. Humanize everything you can. Embrace continuous change." - Scott Brinker, Chief Martec
Brinker's rules look contradictory at first glance. They are not. Centralize the things that should be consistent (brief format, KPI definitions, client reporting). Decentralize the things that benefit from local judgment (creative direction, client relationship). Automate the predictable. Humanize everything that touches a client. The rules are tensions to manage, not steps to execute in order.
Marketing operations maturity model
Most agencies move through five maturity levels as they grow. The widget at the top of this article scores you against the model. The descriptions below explain what each level looks like in agency life and what the jump to the next level requires.
Level 1: Ad-hoc. Operations are improvised. Things ship because of heroics, not systems. Common at year one or two, or after a fast growth spurt where systems did not keep up. The next move is documenting one workflow, usually intake or weekly reporting.
Level 2: Repeatable. Some workflows are documented but each client still feels custom. The brief format varies by client, the reporting template varies by week, the meeting cadence varies by project lead. The next move is standardizing one of those across all clients; the variation should be in the answers, not the structure.
Level 3: Defined. Most ops loops are documented and the team follows them. Quality holds across clients. This is where most healthy agencies sit. The next move is measurement: pick three to five operations KPIs and make the system observable.
Level 4: Managed. Operations are measured. Issues surface in metrics before they hit clients. Sales sees real capacity before committing kickoff dates. Reports loop back into next month's plan. The next move is continuous improvement: a quarterly retro that produces actual changes, not just notes.
Level 5: Optimized. Operations adapt continuously. The system improves itself with low overhead. Most agencies do not need to reach Level 5; the gain from Level 3 to Level 4 is much larger than from Level 4 to Level 5.
The MarketingOps.com 2024 State of the Marketing Operations Professional research found only 7% of organizations reach the highest digital maturity level, with most teams stuck at Repeatable or Defined. That distribution mirrors what we see across agency clients on Rock; the meaningful gains come from cleaning up Level 2 to Level 3, not chasing Level 5.
Tools for marketing operations
Agency marketing operations tooling splits into five layers. The trap most teams fall into is buying a Level 4 tool to fix a Level 2 process problem, which adds cost without solving anything.
Lean tooling beats a heavy stack at agency scale; the stack should fall out of the process, not lead it.
Layer
What it does
Lean agency stack
Stack-heavy enterprise stack
Workspace
Chat, tasks, notes, files in one place per client
Rock, Basecamp, ClickUp
Slack plus Asana plus Notion plus Drive
Production
Briefs, creative reviews, approvals, version history
Workspace plus Figma plus Loom
Workfront, Wrike, Adobe Workfront Fusion
Measurement
Channel analytics, campaign reporting, dashboards
GA4, Looker Studio, native channel dashboards
Tableau, Domo, Marketo Measure, attribution tools
Automation
Email, lead routing, drip sequences
Mailchimp, ActiveCampaign per client
Marketo, HubSpot Enterprise, Pardot
Documentation
SOPs, brand books, process libraries
Notes inside the workspace
Confluence, Notion at company scale
For a 5 to 50-person agency the lean stack on the left is almost always the right answer. The enterprise stack on the right makes sense for an in-house team running a hundred-million-dollar pipeline; for an agency the per-client cost would destroy retainer margins. Project management software for agencies covers the tradeoffs in the workspace layer specifically.
What we recommend
At Rock we run agency operations on the principle that the operating layer should sit where the team already works, not in a separate ops platform. Each client gets one space with chat, tasks, notes, and files together. The brief lives as a note. The production work lives as tasks. The handoffs happen in topics that thread the conversation by phase rather than by message timeline. The monthly report lives in the same space the work lives in.
This is honest about what Rock does and does not do. Rock is the workspace layer; it does not run paid media, it does not do attribution modeling, and it does not replace a real analytics tool for performance reporting. What it does is keep the work, the team, and the client conversation in one place so the operations layer is observable rather than scattered across five tools nobody syncs.
The broader operating model fits together with adjacent disciplines. Marketing project management handles the day-to-day movement of work. Campaign management handles the one-campaign-at-a-time view. Agency KPIs and marketing KPIs together produce the operating dashboard. Capacity planning and billable hours close the loop on the financial side. Operations is the spine that connects these into one functioning system. The marketing funnel is the diagnostic lens operations teams use to find where execution is leaking volume. Multi-channel digital execution rolls up to the digital marketing plan. Resource allocation handles how capacity gets distributed across the work the operations layer runs. Channel-specific plans like an SEO marketing plan inherit from operations and ladder back up at the quarterly review. The annual marketing plan is the artifact that tells operations what to execute against. Channel-specific plans like a content marketing plan and social media marketing plan branch off from there.
Common pitfalls
The mistakes below show up across agencies that intend to build real operations and slowly drift back to firefighting. Most are pattern recognition failures, not analytical ones.
Buying the stack before defining the processA new tool feels like progress and is easier to expense than a process review. The result is an agency running three project-management apps and four document tools, none of which match how the team actually works. Define the loop on a whiteboard first; the stack falls out of the process, not the other way around.
Hiring the ops lead too lateMost agencies wait until the partners are drowning in admin to hire an ops lead, by which point the team has already absorbed a year of bad habits. The signal to hire is around 15 to 20 FTE or when the founders spend more time on internal coordination than on client work. Hiring earlier is cheaper than rebuilding the operating model later.
Letting the ops lead become a martech babysitterAn ops lead who spends the week fixing HubSpot integrations is not running operations. The role is process, capacity, measurement, and improvement. If the senior ops hire is the only person who can save a Mailchimp campaign, the agency has built a single point of failure dressed up as a leadership role.
No standard onboarding loop for new clientsEach new client is different in scope but the onboarding mechanics should not be. Without a standard loop, every kickoff reinvents the brief format, the tool setup, the meeting cadence, and the reporting template. The team burns 20 hours per onboarding that a defined loop would cut to five.
Treating retainer scope creep as ops chaosWhen a retainer feels chaotic, the partners assume operations are broken. Often the operations are fine; the scope is leaking. Three free deliverables a month for the same client is a commercial problem, not an ops problem. Fix the scope agreement before redesigning the workflow.
The biggest of the five is the first one. Agencies that buy the stack before defining the process end up running three project tools, four document tools, and a deeply held grievance about software. The cure is one whiteboard session before any new tool gets evaluated; the loop comes first, the stack falls out of it.
How to start marketing operations this quarter
If your operations sit at Ad-hoc or Repeatable, do not try to jump to Managed in a quarter. The gain from Level 1 to Level 3 is the largest one available, and it is achievable in 90 days with three moves.
Pick one workflow and document it. Intake is usually the highest-leverage starting point because every other workflow downstream depends on a clean intake. Write the steps, name the owner, define the inputs and outputs. Pin it in the workspace.
Move client work into one shared space. If the work, the chat, the tasks, and the files live in five different tools, the operations layer is invisible. One space per client is the lightest possible structure that still shows the team who is doing what.
Standardize the brief format and the report format across clients. The variation should be in the answers, not the structure. Two templates done well move more shops from Level 2 to Level 3 than any tool purchase.
Operations is not a quarterly initiative; it is an ongoing discipline. But the first 90 days of deliberate work usually take an agency further than the next 90 days of incremental improvements ever will. Pick the workflow, pick the workspace, pick the templates. The rest follows.
Run client work and operations in the same place. Rock combines chat, tasks, and notes in one workspace. One flat price, unlimited users. Get started for free.