By clicking “Accept All Cookies”, you agree to the storing of cookies on your device to enhance site navigation, analyze site usage, and assist in our marketing efforts. View our Privacy Policy for more information.
Oops! Something went wrong while submitting the form.
or continue with
This month we shipped four updates: an AI-friendlier public API, a full Spanish interface, sharper space search, and a sweep of UX and stability fixes across web, desktop, and mobile.
Here is what is new.
AI-Friendly Public API
Rock has had a public API for a while. This month we expanded it with the building blocks AI assistants need to act inside your spaces.
The result: you can connect ChatGPT, Claude, Gemini, or any AI assistant, and have it create tasks, send messages, post updates, or pull context from a space. All from a simple conversation.
Claude spinning up a new client project from a brief, straight inside a Rock space.
What that looks like in practice:
Use case
What your AI does in the space
Project kickoff from a brief
Drop a client brief in the space and ask your AI to read it. It breaks the work into tasks, assigns them, and sets the sprint.
Status TL;DR of a space
Coming back from PTO or jumping into a busy space? Ask your AI to read the recent messages, tasks, and notes, and post a summary of where each project stands.
Daily standup recap
Your AI scans yesterday's activity each morning and posts a recap: what shipped, who is blocked, what is next.
Dev updates from Claude Code
Hook Claude Code into your engineering space so it posts when it opens a PR, finishes a build, or pushes a deploy. No more copy-pasting from GitHub.
Client emails to tasks
Paste a long client email and your AI creates the right tasks, with deadlines and owners. No more manual breakdown.
Weekly client recaps
End of the week, your AI scans the space and drafts a status message you can send to the client. Copy, edit, send.
How to set it up
Setup takes minutes. From inside the space you want to plug your AI into:
1. Open Space settings from the space header.
2. Go to Integrations, then Custom Webhook.
3. Click Add new to generate a bot token. (Custom webhooks are part of the Unlimited plan.)
4. Hand the token to your AI assistant. It can now read and act inside that one space, not your whole workspace.
It works the same way MCP connections work in Claude: your AI gets direct access to a single space at a time.
Bring your own key. No per-seat AI fees, no vendor lock-in. Unlike platforms that charge extra for proprietary AI, Rock lets your team use whatever AI they already pay for.
We are actively expanding what the API can do. If there is a workflow you want to automate but cannot yet, let us know.
Rock en Español
Rock is now available in Spanish. The full interface, notifications, and onboarding flow have been translated for Spanish-speaking teams.
Latam is one of our fastest-growing regions, with agencies and small businesses across Mexico, Argentina, Colombia, and Spain running their work on Rock. Until now, those teams worked in English. Now they can work together and with clients in both English or Spanish.
To switch your language: open your user settings, select Language, and toggle to Spanish.
This is our first step toward making Rock accessible to more teams around the world. More languages are on the way. Want to request a language? Poke us in the support space.
Rock now speaks Spanish across the entire workspace.
Sharper Space Search
Space search is now faster and more accurate. Whether you are looking for a message, a task, or a file from a few weeks back, results surface where you expect them.
UX, UI, and Stability
We rolled out a batch of small improvements across the platform: visual refinements, performance updates, and stability fixes on web, desktop, and mobile.
Nothing flashy. Just smoother day-to-day use.
What's Next
This is the start of a busier release cadence for Rock. Over the next few months we will keep expanding the API and shipping the improvements our users ask for most.
Have a feature request or a bug to flag? Ping us in the Rock Support and Updates space. We read every message, and the things you raise shape what we build next.
Searching for "client portal software" surfaces a strange list. Some results are full agency suites with CRM, billing, and white-label branding. Some are shared workspaces where clients join your team's project space as guests. Some are project management tools with a guest-access feature bolted on. They all call themselves "client portals," and they all solve different problems.
This guide compares ten of the most-recommended options across three honest categories, with a 4-question framework so you pick the right category before picking the wrong tool. For the wider collaboration software view, see our best collaboration software guide. Some teams should pick a workspace-style portal. Some should pick a dedicated client portal app. Some should pick a PM tool with guest access. Run the recommender below for a starting point.
Quick answer. Client portal software covers three categories. Workspace-style portals like Rock and Basecamp let clients join your team's project space as guests. Dedicated portal apps like SuiteDash and Copilot give clients a branded portal with billing, e-signatures, and a CRM. PM tools like Monday and ClickUp add guest access to your existing task boards. The right pick depends on what your clients need to do and how much branding matters.
The 3 types of client portal software
Most listicles ranking for "client portal software" lump these three categories together and let the reader sort it out. That is why so many teams pick wrong on the first try. Here is the cleaner breakdown.
Workspace-style portals. Your team and your clients live in the same project space. Chat, tasks, notes, and files are all visible to everyone in the space. There is no separate client-facing portal because the workspace IS the portal. Best when the day-to-day need is communication and shared visibility, not branded presentation.
Dedicated client portal apps. Clients log into a fully branded portal with your colors, your logo, and often your custom domain. These products bundle CRM, invoicing, contracts, e-signatures, and document delivery into the portal experience. Best when the portal is part of how you sell, bill, and present yourself to clients.
PM tools with guest access. Your existing project management tool gives clients limited guest seats to specific lists, boards, or views. The portal is a side feature on top of the PM tool. Best when your team already uses a strong PM tool and clients only need to see status, not interact deeply.
The next three sections cover the strongest picks in each category. The full side-by-side comparison and pricing math come after.
Workspace-style portals
Workspace-style tools treat clients as members of your project space. There is no client login wall to design and no portal to build. The space your team works in is what clients see, with permissions limiting what they can edit.
Best for. Agencies and small teams that talk with clients daily, share files frequently, and need clients to see project status without constant status meetings. Onboarding clients takes minutes because there is nothing custom to set up.
Skip this if. You need a branded portal with your custom domain, a built-in invoicing flow, or e-signatures inside the portal. You also need a different category if clients should see a polished customer-facing experience rather than your team's working space.
Rock: workspace with unlimited cross-org clients
Rock combines messaging, tasks, notes, and files in one project space. Clients and freelancers join as cross-org members at no extra cost. Flat pricing of $89 per month covers unlimited internal users and unlimited external clients on the Unlimited plan.
The difference matters at scale. Many tools count clients as paid seats once you add them. Rock does not. A 30-person agency working with 80 client contacts pays the same $89 as a 5-person agency with 10 clients. The math changes how you think about onboarding small clients.
What we use it for: client kick-offs, weekly syncs, sharing creative work for review, async feedback, and keeping the entire client conversation in one searchable space. The trade-off is that Rock is not a branded portal. Clients see Rock's interface, not yours.
"I use it to manage all my work and tasks and also encourage clients to use as well." - Norman M., Partner, Digital Marketing and Advertising agency (Capterra reviewer, on Basecamp's similar workspace-style approach)
Rock keeps team chat, tasks, and notes in the same project space. Clients join as cross-org guests at no extra cost.
Basecamp: calm async PM with built-in client view
Basecamp has been doing workspace-style client collaboration since 2004. Each project gets a message board, to-do lists, a schedule, a Campfire chat room, and Hill Charts for progress. Clients see a curated view that hides internal threads with one toggle.
Pro Unlimited is $299 per month flat for unlimited users on annual billing. That makes Basecamp a strong pick for teams above 20 people who want predictable cost and a 25-year track record. For smaller teams, Plus at $15 per user per month works but adds up faster.
Dedicated portal apps are purpose-built for the client-facing experience. They wrap project work, billing, and document delivery inside a fully branded portal. Clients see your domain, your colors, and your logo.
Best for. Agencies, consultants, and service businesses that bill clients through the portal, send contracts and proposals through the portal, and want the portal to be part of how they present themselves. The branded experience is the product.
Skip this if. You only need shared communication and task visibility, or your team already runs a project management tool that you do not want to replace. Dedicated portals work best when you commit to running your client-facing operations through them.
SuiteDash: white-label all-in-one
SuiteDash bundles CRM, project portals, file sharing, invoicing, and e-signatures into a fully white-labeled portal with custom domain. Pricing starts at $19 per month flat, and crucially, the cost does not scale with client count. Adding 100 clients costs the same as adding 10.
The trade-off is depth. SuiteDash has its own concepts (Circles, Flows, Permissions) that take real time to learn. Reviewers consistently mention 20-plus hours in the SuiteDash Academy before feeling fluent. The learning investment pays off for teams that want one tool instead of five.
"The branded client portals and mobile app improved our client experience. Clients appreciated having a single place to access files, invoices, messages, and project updates." - Nagur B., Marketing Consultant, Marketing and Advertising agency (Capterra reviewer)
Copilot: agency CRM with billing built in
Copilot positions itself as the client-facing operating system for modern agencies. Branded portal, messaging, billing, contracts, e-signatures, and a lightweight CRM all live in one product. Pricing starts around $69 per month for a small team and scales with internal users.
The fit is strongest for service businesses where invoicing flows through the portal. If you already use Stripe or QuickBooks for billing and a separate tool for contracts, Copilot's bundle has appeal. It makes sense around the point where consolidating tools saves more than the subscription costs.
FuseBase: AI agents and automations on portals
FuseBase, formerly Nimbus, leans into AI and automations. The Essentials plan covers 100 clients with 10 portals and includes AI Agents with monthly request quotas. Advanced adds white-label support and unlimited portals with much larger quotas.
Strong fit for teams that want to automate routine client work, like sending recurring reports, summarizing meeting transcripts, or generating onboarding documents. The AI angle is genuine here, not bolted on.
SuperOkay: branded portals for creative agencies
SuperOkay focuses on creative work. Document builder, project handoff, and brand presentation are the strengths. Solo+ at $29 per month covers 5 clients with full white-label and custom domain. Business at $112 per month is unlimited.
The pricing tiers depend on client count, which is rare in this category. Most dedicated portals charge flat. SuperOkay's tiered model is fine if you are a solo or small agency, less so if you scale past 20 active clients quickly.
Clinked: document-heavy compliance portals
Clinked targets industries where document handling and audit trails matter. Lite starts at around $95 per month flat and the higher tiers add granular permissions, audit logs, and compliance certifications. The portal is white-label-capable and mobile-friendly.
Best for legal, financial advisory, and accounting practices. Less good for fast-moving creative agencies that want a chat-first experience.
Dedicated client portal apps consolidate the agency stack: CRM, billing, file sharing, and project work inside one branded experience.
PM tools with guest access
If your team already runs a strong PM tool, the simplest "client portal" is to add the client as a guest. Most modern PM tools support guest seats with limited access to specific lists, boards, or views.
Best for. Teams that already pay for a PM tool and only need clients to see project status, leave a comment, or download a file. The tooling investment is already made, so adding guests costs little or nothing extra.
Skip this if. Clients need to message your team in real time, see invoices, sign documents, or interact with anything outside the PM scope. Guest access is a feature, not a complete portal experience.
Monday.com: visual boards with guest seats
Monday's color-coded boards make project status easy for non-technical clients to scan. Guests are supported on the Standard plan at $12 per seat with a 3-seat minimum. Visual workflow status doubles as a client-facing dashboard with no extra setup.
The limit is the guest-seat allowance per plan. If you need many client guests across many projects, Monday's per-seat math gets expensive fast. For more on this, see our Monday alternatives guide.
ClickUp: guest views per list
ClickUp offers granular guest access on the Unlimited plan at $7 per user per month. You can give clients view-only access to specific lists, dashboards, or docs. The owner gets 5 free permission-controlled guest seats and each added paid seat adds 2 more, so a 5-person team has roughly 13 free interactive guests. Beyond that you add paid seats or move to Business.
For agencies running many small client engagements, ClickUp's deep PM features plus generous guest allowance is a strong combination. The trade-off is the learning curve. See ClickUp alternatives if simplicity matters more than depth.
Nifty: agency-shaped milestones for clients
Nifty is positioned for client services from the start. Milestones, shared timelines, and automatic client updates are first-class features. Pricing starts at $9 per seat on Pro with white-label available on higher tiers.
Smaller in awareness than Monday or ClickUp, but a clean fit for agencies that want client-facing transparency without learning a generic PM tool.
Side-by-side comparison
Ten tools across three categories, with the trade-offs that matter for picking. White-label and built-in billing usually dictate which category you need before pricing enters the picture.
Tool
Category
Best for
White-label
Billing / e-sig
Free plan
Pricing
Rock
Workspace
Chat, tasks, notes, files with clients in shared spaces
No
No
Yes (5 members/space)
$89/mo flat (unlimited users)
Basecamp
Workspace
Calm async PM with built-in client view
No
No
Yes (1 project, 20 users)
$15/user or $299/mo flat
SuiteDash
Dedicated
White-label all-in-one (CRM, billing, portal)
Yes (custom domain)
Yes
14-day trial
From $19/mo flat
Copilot
Dedicated
CRM, billing, contracts inside a branded portal
Yes
Yes
14-day trial
From $69/mo + per internal user
FuseBase
Dedicated
AI agents, automations, branded portals at scale
Yes (Advanced+)
Limited
Yes (5 client projects)
From ~$38/mo
SuperOkay
Dedicated
Branded portals for creative agencies
Yes (Solo+)
No
Yes (1 client, 1 project)
$9-$112/mo
Clinked
Dedicated
Document-heavy portals with compliance controls
Yes
No
10-day trial
From ~$95/mo flat
Monday.com
PM + guest
Visual boards with client guest access
No
Add-on
Yes (2 seats)
From $9/seat (3 min)
ClickUp
PM + guest
Deep PM with guest views per list
No
Add-on
Yes (unlimited tasks)
From $7/user/mo
Nifty
PM + guest
Agency-shaped PM with milestones for clients
White-label tier
No
Yes (limited)
From $9/seat
Real cost at 5, 15, and 30 clients
Most listicles model 10 clients and stop. Below is the verified annual cost on a 5-person internal team across three client volumes (5, 15, 30 active client portals). Pricing models differ enough that the same tool can be the cheapest at one size and the most expensive at another.
Tool
5 clients
15 clients
30 clients
Pricing model
Rock Unlimited
$899
$899
$899
Flat for unlimited team and clients
Basecamp Pro Unlimited
$3,588
$3,588
$3,588
Flat for unlimited team and clients
SuiteDash Start
$228
$228
$228
Flat for unlimited clients
SuperOkay
$348 (Solo+)
$1,344 (Business)
$1,344 (Business)
Tiered by client count
Copilot Starter
$828
$828
$828
Flat plus per-internal-user fees
ClickUp Unlimited
$420
$504
$720*
$7/user; ~13 free permission guests on 5 paid seats. *30 clients best on Business plan ($12/user)
Monday Standard
$864
$1,152
$1,728
$12/seat (3-min). 3 free guests, then 4-guest groups = 1 billed seat. Viewers unlimited free
Annual cost on a 5-person internal team with interactive client access (commenting, uploading, editing). 2026 list prices, billed annually. Monday viewers and ClickUp view-only links can be free; verify guest policies on each vendor pricing page.
Three things stand out. First, dedicated portals like SuiteDash and Rock's flat pricing are the cleanest cost story. Adding clients does not change the bill. Second, PM tools with guest access (Monday, ClickUp) scale cost as you add interactive clients beyond their free guest caps. Monday Standard runs $864 at 5 clients and crosses $1,700 at 30. ClickUp can stay cheaper by upgrading to Business ($720 at 5 seats) once you outgrow Unlimited's guest allocation. Third, SuperOkay is the only dedicated portal here that scales by client count. Solo+ caps at 5 clients, and Business is the realistic plan for any growing agency.
Add the cost of any tools you would replace. Many agencies end up running a project management tool plus a chat tool plus a billing tool plus a file storage tool. A consolidated workspace or dedicated portal saves on subscription stacking, even when the headline number looks higher. For broader cost modeling, see our best task management apps guide and project management software for agencies.
How to pick: 4-question framework
Before comparing tools, decide which category you are shopping in. These four questions get you to the right one in under two minutes.
1. What do clients need to do in the portal? If they mostly message and see status, workspace-style is enough. If they pay invoices or sign contracts, you need dedicated. If they only need a status board, PM with guest access works.
2. Does the portal need to be white-labeled? If yes, you are in the dedicated category. Workspace and PM-with-guest options show their own brand, not yours.
3. How many active client portals do you run at once? Below 20, almost any tool works. Above 50, dedicated portals with flat pricing pull ahead. Tiered tools like SuperOkay get expensive fast at high client counts.
4. What does your team already use? If you already run Monday or ClickUp internally, adding guest access is the easiest path. If you are starting fresh, the workspace or dedicated routes are usually cleaner than retrofitting.
What we recommend
The honest answer is that "client portal software" is three different products, and most teams pick the wrong category before picking the wrong tool. Here is how we think about it at Rock.
Pick a workspace-style portal (Rock, Basecamp) when the daily need is communication and shared visibility with clients. You write to clients more than you bill them. You want clients to see project status without a separate dashboard. Onboarding new clients should take minutes, not a setup project.
Pick a dedicated portal (SuiteDash, Copilot, FuseBase, SuperOkay, Clinked) when the portal is part of how you sell and bill. White-label branding matters because clients see the portal often. Invoicing, contracts, and document delivery all flow through the same place.
Pick PM with guest access (Monday, ClickUp, Nifty) when you already have a PM tool you love and clients only need to see boards or status. Guest access is a feature you flip on, not a separate product to evaluate.
Where Rock fits: small to mid agencies that talk with clients daily, share files often, and want a single space for the whole conversation without per-seat fees. Not the right fit if you need a fully branded portal or built-in invoicing. Right fit if your real friction is switching between three apps to manage one client relationship.
PM tools like Monday let clients see status as a guest on existing boards, no separate portal to design.
FAQ
What is client portal software?
Client portal software is any tool that lets external clients access project work, files, messages, or services from your business. The category covers three different products. Workspace-style tools let clients join your project space. Dedicated portal apps offer branded experiences with billing. PM tools layer guest access on top of task boards.
What is the best free client portal software?
Several tools have free tiers. Rock includes 3 group spaces with 5 members each on the free plan, which works for small client work. SuperOkay's free plan covers 1 client and 1 project. FuseBase covers 5 client projects free. The right free pick depends on which category fits your work, not just on price.
Do I need white-label branding on the portal?
It depends on how often clients see the portal and whether the portal is part of your sales experience. Agencies that send proposals, contracts, and invoices through the portal usually want white-label. Teams that share files and chat with clients can usually skip it without damaging the relationship.
Can I use a project management tool as a client portal?
Yes, with limits. Monday, ClickUp, Asana, and Nifty all support guest access. The limit is that guests usually see less than internal users. Real-time messaging is rarely a guest feature, branding is usually missing, and billing is not part of the product. Use this path when status visibility is enough.
How much does client portal software cost?
Workspace-style tools: $0 to $300 per month flat. Dedicated portals: $19 to $300 per month, flat or tiered by client count. PM with guest access: typically $7 to $19 per internal seat with guest seats free or capped per plan. The pricing model matters more than the headline number once you scale past 10 active clients.
Want a workspace where chat, tasks, and notes live together with clients included? Rock combines all three with flat pricing for unlimited users and unlimited cross-org clients. Get started for free.
According to Wrike's 2024 Impactful Work Report, marketing teams waste almost 13 hours a week on meetings and duplicative work. That works out to about $15,138 per knowledge worker per year. The number is bigger for agency teams running campaigns for several clients at once, because the duplicated work compounds across each project.
Marketing project management is the discipline that fixes this. For content teams specifically, this layer is described in the content marketing plan. For SEO-led work specifically, the SEO marketing plan is the upstream artifact; for social, the social media marketing plan sets the cadence. For the upstream decision of who works on what and for how many hours, see resource allocation. It is the execution layer underneath the annual marketing plan. It sits inside the broader marketing operations layer that runs across every client account. It is how you take ten campaigns, four stakeholders per campaign, and a team that ships across time zones, and turn them into something the team can actually run without burning out. This guide covers what marketing project management is, how the workflow runs, where it breaks in practice, and which frameworks actually fit marketing work.
If you run client campaigns or split a small team across multiple projects, the bottlenecks section below is where most of the practical value lives.
Marketing project management is a system for shipping campaigns at the pace the work actually moves, not the pace the calendar suggests. A project roadmap is the artifact that makes that pace visible to the team and the client.
What Is Marketing Project Management?
Marketing project management is the practice of planning, running, and measuring marketing work as a system rather than a series of one-off campaigns. It defines how briefs get written, how work moves from idea to launch, who owns each stage, and how the team adapts when priorities shift. The goal is to ship marketing on time without exhausting the team or surprising the client.
It is broader than running a single campaign, and narrower than the wider business strategy. Project management for marketing sits between strategy and execution, and it is what most agencies and in-house marketing teams actually live in day to day. The dedicated role, the marketing project manager, owns the workflow itself rather than the creative strategy output.
"Agile marketing is not simply 'Agile applied to marketing,' but a full operating system designed for the ambiguity, creativity, and cross-functional challenges that modern marketing teams face." - Andrea Fryrear, AgileSherpas
That framing matters. Marketing work is not a software feature with a clear definition of done. Briefs change, copy gets rewritten in review, design needs three rounds, the client moves the launch. Treating marketing PM as generic project management with marketing words misses the point. The practices are the same in spirit; the friction is different.
The Marketing PM Workflow
Most marketing work moves through five phases. Names vary across teams. The sequence does not.
IntakeA request lands. Maybe it is a new campaign brief from a client, a paid ads test from the strategy lead, a content piece from editorial. The intake step turns it into a defined piece of work with an owner, a deadline, and a clear scope. Skipping intake is the most common cause of "wait, who asked for this?"
PlanningThe team breaks the work into tasks, assigns owners, schedules dependencies. For a campaign, this includes the creative brief, the asset list, the channel plan, the launch date. For ongoing retainer work, planning is lighter and runs continuously.
ProductionThe work happens. Copy, design, dev, video, paid setup. This phase is where the most time is spent and where the most invisible context-switching happens, especially when team members are split across multiple clients.
ReviewInternal QA first, then client or stakeholder approval. This is where most marketing campaigns slow down, because reviewers have other priorities and approvals are sequential.
Launch and measureThe work goes live. Metrics get tracked against the goal. Lessons feed back into the next campaign through a retrospective or postmortem, which most teams skip even when they know they should not.
"The primary hallmark of a successful publisher is consistency, both in terms of quality and delivery." - Joe Pulizzi, Content Marketing Institute
Pulizzi was writing about content marketing, but the point applies wider. Marketing project management is the machinery that lets a team be consistent. Without the machinery, output depends on whoever is least busy that week. With it, output depends on the workflow.
Where Marketing PM Actually Breaks
Every team that picks up marketing project management hits the same five bottlenecks. The five-phase workflow is the bones; this is where the meat of the work happens.
Slow approvals
The 2026 State of Agile Marketing Report found that 92% of marketers report collaboration issues with other teams. Among non-Agile teams, 46% point to slow approvals as the single biggest barrier. Approvals are the bottleneck almost every other bottleneck flows through.
The fix is rarely "ask the client to be faster." Clients are busy. The fix is structural: name the smallest possible reviewer set per campaign, define what they are reviewing for (copy versus brand alignment versus legal), and make the review asynchronous. A board where every card has a single named reviewer and a 24-hour SLA outperforms a weekly status meeting where everything piles up.
The cleanest version of this is a Topic thread per approval: tag the reviewer, attach the deliverable, write the 24-hour SLA into the title. The reviewer reads async and comments inline.
A Topic per approval keeps the reviewer, the deliverable, and the SLA in one async thread instead of a meeting.
Capacity mismatch across campaigns
For agencies, this is the bottleneck that gets the least attention and causes the most damage. One designer is on five clients. The account manager is juggling eight retainers. The strategist split her time across three pitches last week. Generic marketing PM advice assumes a dedicated team on one campaign. Real marketing teams almost never look like that.
AgileSherpas data shows 40% of Agile marketers cite capacity mismatch as their top operational barrier. Solving it requires visibility (you cannot manage what you cannot see) and explicit Work-In-Progress limits per person, not per project. If your designer is at three active campaigns, the fourth waits in the backlog. This is where Kanban thinking pays off, with explicit Work-In-Progress limits forcing the capacity conversation up front.
Most teams write the WIP limit into the column name on their Board view (for example "In Progress (3)") and treat it as a social contract rather than a software lock.
The WIP limit lives in the column name itself. Edit the list to "In Progress (3)" and the constraint stays visible to everyone on the board.
Outdated planning cadence
Annual marketing plans were always a fiction. Today they are a liability. The same AgileSherpas data shows 89% of Agile marketers update their plans at least monthly, compared to 66% of non-Agile teams. The Agile group is also 23 points more likely to feel that planning drives important work (82% versus 59%).
The takeaway is not "throw away the annual plan." It is "treat the annual plan as direction, not commitment, and replan monthly." Quarterly OKRs plus monthly sprint planning sessions for the campaign work give a working baseline. Anything longer drifts.
A working baseline for marketing teams: a Sprint every two to four weeks for the campaign work, with the quarterly direction kept in a shared note above the board.
Sprint cadence is set with a start date and duration. Two to four weeks is the working baseline for marketing teams.
Scope creep on creative work
Creative scope is harder to define than software scope. "One landing page" can mean five sections or twenty. "A social campaign" can mean six posts or sixty. Without a clear scope agreement up front, every revision feels reasonable in isolation and the project quietly doubles in size.
The fix is a written scope statement per project that names what is in, what is out, and what counts as a change request. Our scope of work template covers the format. The trick is not the template though; it is using it as the reference when revisions arrive, instead of saying yes by default.
Tag every change request with a Custom Field marking it scope-in or scope-out (Custom Fields are on the Unlimited plan; on free, a label does the same job). The scope conversation then happens at the task level, before the work starts.
Adding a Custom Field on a campaign task. A simple scope-in / scope-out field makes change requests visible at the task level.
Lack of cross-team visibility
The marketing team knows what they are working on. Sales does not. Strategy does not. The client has a vague sense from last week's status email. Each blind spot creates rework: sales pitches a campaign that is not ready, strategy plans for a launch the team cannot hit, the client requests something already in flight.
Visibility is solved by one shared board where every active piece of work lives, including external collaborators. Status emails are not a substitute. A status email reflects the board at one moment; the board reflects reality.
One shared space per project including the team and the client via cross-org sharing, with no per-seat cost for adding people outside your organization.
Agile principles match marketing work better than Waterfall: short cycles, frequent feedback, and replanning as the work teaches you.
Frameworks That Work for Marketing
You do not need a single project management framework for all marketing work. The honest pattern most teams settle into is a hybrid: different frameworks for different types of work, run on the same board.
Kanban for retainers and continuous flow. Ongoing SEO, social posting, email, paid ads optimization. Work arrives unpredictably and never really ends. Kanban handles this without sprint commitments. Set a Work-In-Progress limit per stage and per person, pull new work as capacity opens.
Sprints for campaigns and launches. A brand campaign with a launch date, a website redesign, a content series, a paid ads test with fixed budget. Agile sprints give the cadence and the forcing function. Two-week sprints are the default for marketing teams; one-week sprints work for fast-moving editorial teams.
Hybrid for the realistic agency stack. Most agencies run Kanban on retainer work and Sprints on fixed-scope projects, all on one team. Same workspace, same people, different disciplines per project type. The risk is taking only the visible parts of each framework (boards, sprints) and skipping the discipline (WIP limits, sprint goals). Pick the elements that solve actual problems, not the ones that sound good in a proposal.
Tools You Need
The tooling is less interesting than the workflow. Any setup needs four things: a board for the work in flight, a way to discuss the work next to the work, a place for shared documentation (briefs, retros, scopes), and a way to bring clients and freelancers in without paying per seat for them.
Stack-fit matters more than feature count. A simple tool the team actually updates beats a powerful tool nobody touches. The main task management options all support a board view; the differences show up in pricing, client access, and integrated chat.
What We Do at Rock
We run a hybrid model internally. Each project has a single space holding the board, the chat, the briefs, and the files. Kanban for ongoing flow, weekly sprints for campaign work, async standups via Topics (our threaded chat) so we are not pinning everyone to a meeting across time zones. Monthly retrospective in a shared note.
For agency clients we observe on Rock, the pattern that works is the same with one addition: clients and freelancers join the project space directly via cross-org sharing, so the board is the source of truth for everyone. No status email, no parallel client tool, no per-seat charge for the client to see the board. Visibility solved by sharing, not by reporting.
The honest limitation: we do not auto-enforce WIP limits. Teams write the limit into the column name (for example "In Progress (3)") and respect it as a social contract. That works for teams under 20. Bigger teams probably need software-enforced limits. Pair the workflow with the right marketing KPIs so you can tell whether the system is actually shipping work, not just tracking it.
Plans live next to the work. Briefs, sprint goals, and asset lists in the same workspace as the board cuts most of the back-and-forth.
Final Thoughts
Marketing project management is not a separate discipline you bolt onto a marketing team. It is the structure that lets a marketing team ship work consistently. Lifecycle gives you the bones. The five bottlenecks above are where the actual day-to-day battles happen, and where most generic PM advice runs out.
"Because its purpose is to create a customer, the business enterprise has two, and only two, basic functions: marketing and innovation." - Peter Drucker, The Practice of Management, 1954
Drucker wrote that seventy years ago, and it still sets the stakes. Marketing is not a support function. It is one of the two things a business does. Treating it like an afterthought, run on whoever is least busy that day, is a strategic error before it is an operational one. Marketing project management is the operational answer to that strategic point.
Start with the bottleneck that is hurting most this quarter. Slow approvals, capacity, planning cadence, scope, or visibility. Fix one, run for a month, fix the next. The teams that improve fastest are not the ones that adopt the most frameworks. They are the ones that pick the right bottleneck and actually solve it before moving on.
Run your marketing projects in one place. Rock combines chat, tasks, and notes in one workspace. One flat price, unlimited users including clients and freelancers. Get started for free.
Virtual meeting etiquette is the difference between a 30-minute call that lands a decision and a 45-minute call that ends in a Slack thread the next day. The rules are simple but the discipline is not. Most teams know what good looks like and still drift into mute fails, multitasking, and meetings that should have been emails.
This guide covers what virtual meeting etiquette is, why it matters, and the 10 rules that actually move the needle. It walks through the camera-on-versus-off debate, etiquette for hybrid teams, and the common mistakes that turn calls into time theft. Skim the rules, run the camera decision table for your context, then keep the pitfall list near your calendar invite.
Quick Answer: What Is Virtual Meeting Etiquette?
Virtual meeting etiquette is the set of rules participants follow to make video and voice calls productive and respectful. It covers preparation such as an agenda and a tech check, behavior during the call like mute discipline, attention, and turn-taking, and follow-up with a written recap of action items. Most rules are universal across Zoom, Google Meet, Jitsi, or any platform. Good etiquette protects the three things bad calls drain: time, attention, and trust. Match camera state to meeting type, give hybrid teams one laptop per person, and close every call with next steps. Start by sending an agenda 24 hours ahead.
Why Virtual Meeting Etiquette Matters
Bad meeting etiquette is expensive in three ways: lost time, lost attention, and lost trust. Steven Rogelberg's research in HBR found that 83% of managers labeled their meetings unproductive. The cost compounds across a workforce because every poorly run call multiplies wasted hours by attendee count.
Good virtual meeting etiquette starts with full attention on the call, not the second monitor.
The interruption load is just as costly. Microsoft's 2025 Work Trend Index reported that employees are interrupted every two minutes during core work hours, often by meetings, emails, and chats. Half a workday goes to interruption recovery instead of the work itself.
And then there is the trust dimension. A team member who shows up late, multitasks visibly, or interrupts repeatedly tells the room what they think of the meeting. That signal carries past the call into how the rest of the team treats them. The 10 rules below are mostly about getting that signal right.
The 10 Rules of Virtual Meeting Etiquette
The list below ranks by impact, not by alphabet. The first three are table stakes. The last three are the ones most teams skip and pay for.
Rule
What it means
Why it matters
1. Send an agenda 24 hours ahead
Three to five bullet points covering the goal, topics, and decisions you want by the end.
Without an agenda, the meeting drifts into freeform discussion and ends without action.
2. Test tech and join 2-5 minutes early
Quick mic and camera test, restart the app if you have not used it that day.
The first minute should not be "can you hear me now?"
3. Mute by default, unmute to speak
Mute the moment you join, stay muted unless you are talking, use push-to-talk if available.
One person's side noise ruins audio for everyone on the call.
4. Make a deliberate camera-on/off call
Camera on for trust-building (1:1s, new clients, brainstorms); off for status updates and large all-hands.
The chaotic mix where some attendees feel obligated to be on and others are off is the worst etiquette.
5. Background, lighting, dress: in-person standard
Tidy or blurred background, lighting on your face, dress as you would for the in-person version.
Pajamas read as "I do not respect your time" even when your work is excellent.
6. Single-task: close the inbox
Close email, mute Slack, turn off the second monitor, set Do Not Disturb on the laptop.
Eyes-darting on the call reads as visible disengagement; a brief glance at chat costs more focus than you think.
7. Don't interrupt; pause for the lag
Wait two seconds longer than feels natural after the previous speaker finishes.
Network lag and missing body-language cues weaken the natural turn-taking signals you rely on in person.
8. Use chat, hand-raise, and reactions for equity
Quieter team members get their thoughts in via chat or hand-raise instead of having to break in.
Virtual meetings amplify the loudest voices; non-native speakers and time-zone-disadvantaged attendees lose airtime fast.
9. Recap with action items within 24 hours
Last 5 minutes of the call: decisions, action items with owners, next checkpoint. Post the recap as a written note.
Without a recap, the meeting becomes a debate that has to be repeated when memory fades.
10. Cancel meetings that should be async
Decline a meeting that does not need a meeting. Status updates and FYIs work better as written messages.
The most respectful thing you can do is route the right communication to the right channel.
Camera On or Off: The Real Debate
The "always cameras on" rule is dead, and the data killed it. Stanford's 2023 Zoom Exhaustion and Fatigue Scale study found that 13.8% of women and 5.5% of men reported feeling "very" or "extremely" fatigued after video meetings. The fatigue is real, gendered, and worse for back-to-back days.
The smarter rule: pick the camera state by meeting type. The table below is the version we hand to teams running this debate live.
Meeting type
Default
Why
1:1 with manager or report
Camera on
Trust and rapport build through faces. The cost of fatigue is small in a 30-minute meeting between two people.
First meeting with a new client
Camera on
Visual presence sets the tone for the relationship. Ask the client to do the same.
Brainstorm or design critique
Camera on
You read reactions, hesitation, and excitement. Camera off blunts the discussion.
Status update or standup
Optional
Short, structured, low-rapport need. Default to off if you have back-to-back calls and need a break.
All-hands with 20+ attendees
Camera off
Tiles shrink to thumbnails; camera-on adds bandwidth and fatigue without benefit. Speaker on, audience off.
Walking, commuting, or sick
Camera off
Distracting backgrounds and being unwell are reasonable camera-off triggers. Voice-only signals respect, not absence.
Long deep-work review (60+ min)
Optional
Fatigue compounds over time. Halfway-through camera-off breaks are reasonable, especially in distributed teams.
Two more rules of thumb. First, the host sets the norm: if the host turns the camera off, attendees will too. Second, declare the norm in the invite. "Cameras off, working session" is a courteous heads-up that nobody has to scramble to clean up the room.
Hybrid Meeting Etiquette: One Laptop Per Person
The fastest way to ruin a hybrid meeting is to have three people in the conference room sharing one laptop while four people join from home. The remote attendees lose audio quality, body-language cues, and conversational airtime. They become passive listeners.
One laptop per person is the hybrid meeting equity rule that most teams still skip.
The fix has been the same since 2020 and most teams still do not do it. If anyone is remote, everyone joins from their own laptop, even the ones in the same office. Each person gets their own camera tile. The room camera becomes a fallback, not the default. Our daily standup guide covers the same rule for daily check-ins because the equity problem is identical.
The other hybrid rule is air-time discipline. The host actively invites remote attendees to speak. Going around the room is fine; going around the room and skipping the four people on screen is the failure mode that kills hybrid culture.
Common Virtual Meeting Mistakes
The patterns below show up across teams that adopt virtual-meeting tools without writing down their own etiquette. Most are about treating the call as an extension of in-person meetings instead of recognizing the medium has its own rules.
Forgetting to mute and broadcasting your kitchenSide conversations, dogs, kettles, and keyboard noise pile onto the call. Mute by default. Use push-to-talk if your tool offers it. The host should keep an eye on the unmute icons and prompt the offender privately in chat.
Multitasking with the camera onReading email or Slack on a second monitor reads as eyes-darting on the call. Either close the inbox and stay present, or turn the camera off and at least be honest about the split focus. Pretending to listen is the rudest option.
Late join, late mic, late contextJoining 5 minutes late and asking the team to recap means the rest of the meeting moves at your pace. Join 2 minutes early. If you are genuinely late, mute, listen, and catch the recap in writing afterward.
Camera-off as a fashion shieldHiding the camera because you have not showered is fine occasionally. Doing it every meeting signals disengagement. Pick a default and own it. If your team norm is camera-on, dress like you would in person, not like you are hiding.
The interrupt spiralTwo people start talking, both stop, both restart, both stop again. Pause two seconds longer than you would in person before speaking. Network lag and missing body-language cues mean the natural turn-taking signals are weaker.
No recap, no action items, no ownersA meeting that ends without written next steps gets re-run as a Slack thread next week. Spend the last 5 minutes summarizing decisions, action items with owners, and the next checkpoint. Post the recap within 24 hours.
The biggest of these is multitasking with the camera on. It is the visible version of disrespect. If you genuinely have to do parallel work, turn the camera off and tell the room. Pretending to listen while typing in another window costs more trust than admitting you are double-booked.
What We Recommend
At Rock we keep virtual meeting etiquette as a 10-line pinned note in the project space. The rules above sit at the top, the camera decision table sits below, and the recap template waits at the bottom. New team members read it on day one. The host references it when the call drifts.
The reason for keeping etiquette inside the workspace is the failure mode otherwise. Etiquette docs that live in a wiki or onboarding deck become decoration. They get read once and forgotten when the meeting actually starts. A pinned note with the rules plus the recap from each meeting keeps the etiquette alive when the team needs it.
Pair this with the broader meeting toolkit. Our meeting agenda examples cover the 8 templates that handle most call types. The retrospective guide covers the closing ceremony for sprint cycles. The Zoom vs Google Meet comparison covers tool selection. Together they form a complete picture of running better calls.
Pin virtual meeting etiquette inside the project workspace. Rock combines chat, tasks, and notes in one workspace. One flat price, unlimited users. Get started for free.
Frequently Asked Questions
What are the do's and don'ts of virtual meetings? The five do's: send an agenda, test tech early, mute by default, recap with action items, and cancel meetings that should be async. The five don'ts: do not show up late, do not multitask with the camera on, do not interrupt without pausing, do not run over the time-box, and do not skip the recap. The rest are variants of these.
Should my camera always be on? No. Cameras on for trust-building meetings (1:1s, new clients, brainstorms) and off for status updates, large all-hands, and long deep-work reviews. Pick a default for the team and write it into the calendar invite to remove ambiguity.
How early should I join a virtual meeting? Two to five minutes early. Earlier than that risks awkward small talk; later means the host is waiting on you. If your tool requires a 30-second app restart on first use that day, build that into the buffer.
What is the rule of 7 in meetings? The "rule of 7" is shorthand for keeping meetings to seven attendees or fewer. More attendees mean less airtime per person and more passive listeners. The number is not magic, but the principle holds: the smaller the meeting, the higher the engagement.
How do you handle technical issues professionally? Acknowledge the issue once, then move forward. "I am going to drop and rejoin" is enough. Do not narrate every troubleshooting step. If the issue persists, switch to phone audio or chat, and follow up with the recap so you do not lose context.
What should you not do in a virtual meeting? Do not arrive late, do not multitask with the camera on, do not eat full meals on camera, do not take other calls during the meeting, do not forget to mute, and do not skip the recap. The list of "should-nots" is shorter than the list of "shoulds" but each violation costs disproportionately more trust.
ClickUp and Basecamp solve project work in opposite directions. ClickUp is the everything app. List, board, Gantt, calendar, workload, mind map, automations, time tracking, dashboards, AI, all in one product, all configurable. Basecamp is the opposite. To-dos, schedules, message boards, Hill Charts, and Campfire chat live inside one calm, opinionated workspace, and you adjust your team to the tool.
That single difference shapes everything else. This ClickUp vs Basecamp guide compares them honestly across philosophy, features, AI, and pricing, and runs the real annual cost at 5, 15, 30, and 50 seats. Some teams should pick ClickUp. Some should pick Basecamp. Some should pick neither because the chat-first workspace closer to how your team actually communicates lives somewhere else. Run the recommender below for a starting point.
Quick answer. ClickUp is a customizable PM platform with deep features and a steep learning curve. Basecamp is opinionated PM with built-in messaging and a one-day onboarding. Pick ClickUp if your team will invest two to four weeks of setup for long-term flexibility. Pick Basecamp if you want a calm tool that works on day one. Pick neither if you want chat-first agency work with clients in the same space.
Need chat in the same workspace?
Rock pairs messaging with tasks and notes. One flat price, unlimited users.
ClickUp launched in 2017 with a simple pitch. One app to replace them all. Tasks, docs, goals, chats, whiteboards, mind maps, time tracking, and dashboards all live inside one workspace, and the company ships new features almost weekly. The free plan is one of the most generous in the category. Unlimited tasks, unlimited members, and access to most core features at $0.
The trade-off is depth. ClickUp gives you 15 plus task views and a deep workspace hierarchy (Workspaces, Spaces, Folders, Lists, Tasks, Subtasks). The Unlimited plan adds 1,000 monthly automations, and ClickUp Brain is a separate AI add-on at $9 per user per month. Most teams report two to four weeks before everyone is fully comfortable. Power users love it. New hires often need a champion to walk them through setup.
"ClickUp is extremely easy to use and adaptable to different needs… we can customize pretty much anything." - Erica C., VP of Creative, Marketing & Advertising agency (Capterra reviewer)
Erica makes the point well. ClickUp consolidates a lot of tools into one place, which is exactly its appeal for teams ready to invest setup time. For a wider field of options, see our ClickUp alternatives roundup. For a more direct PM head-to-head, our ClickUp vs Monday comparison covers the per-seat versus per-seat split.
ClickUp gives you 15 plus task views inside one workspace, with custom fields and dashboards layered on top.
What Basecamp is built for
Basecamp has been around since 2004 and has stayed close to one idea. Project management should be calm. Each project gets a message board, to-do lists, a schedule, a chat room called Campfire, real-time pings, file storage, and Hill Charts that visualize uphill and downhill phases of work. The features are deliberately limited. There is no native Gantt chart with cross-task dependencies, no built-in time tracking on the standard tier, and no AI features.
That last point is intentional. 37signals, the company behind Basecamp, has been openly skeptical of bolting AI features onto every product. Founder David Heinemeier Hansson wrote about Basecamp becoming agent-accessible in late 2025. Instead of baking AI features in, 37signals revamped the API and added a CLI so external agents can drive Basecamp from the outside. The bet is that users will pick their own AI rather than accept the one baked in.
"Clean interface and straightforward structure made it easy for everyone on the team." - Radha S., Legal Assistant, Legal Services (Capterra reviewer)
Radha captures the appeal. Basecamp arrives with a finished product and the layout is fixed. New teammates open it and know where to write a status update, where to add a to-do, where to start a chat. Onboarding takes hours, not weeks. For agency owners onboarding freelancers and clients across time zones, the finished-product feel reduces friction. Teams that want a deep wiki or formal Gantt-based PM will find Basecamp limiting. For the wider field, see our Basecamp alternatives guide.
Basecamp ships every project with the same calm layout. Message board, to-dos, schedule, docs, chat, and Hill Charts.
ClickUp vs Basecamp side-by-side
Five axes matter when picking between these tools. Philosophy, tasks and project management, communication and chat, AI in 2026, and pricing model. Here is how each one stacks up.
15+ (List, Board, Gantt, Calendar, Workload, Timeline, Mind Map)
To-dos, Schedule, Card Tables (Kanban), Hill Charts
Built-in chat
ClickUp Chat (added 2024)
Campfire and Pings
Time tracking
Native, Unlimited plan onward
Add-on ($50/mo Timesheet)
Automations
1,000/mo on Unlimited, 5,000 on Business
None native
AI in 2026
ClickUp Brain ($9/user/mo add-on)
None native (deliberate). API and CLI for external agents
Free plan
Unlimited tasks and members, 60 MB storage
1 project, 20 users, 1 GB
Paid from
Unlimited $7/user/mo, Business $12/user/mo
Plus $15/user/mo, Pro Unlimited $299/mo flat
Client access
Guests on paid plans
Built-in client view (hides internal threads)
Onboarding time
2 to 4 weeks for full team adoption
1 to 2 days
Mobile
Functional, occasional lag reports
Strong
Philosophy: customization vs calm
This is the spine of the ClickUp vs Basecamp comparison. ClickUp arrives with components. Views, custom fields, automations, dashboards, and templates all wait to be configured. The team architect decides what every list looks like, what fields every task carries, how dashboards aggregate. The flexibility is real.
Basecamp arrives with opinions. Each project gets the same set of tools. Message board, to-dos, schedule, chat, docs and files, Hill Charts. The trade-off is real on both sides. ClickUp pays off after weeks of investment. Basecamp pays off on day one but hits a ceiling once teams need formal project management with dependencies and resource workload views.
Tasks and project management
ClickUp wins on raw depth. List, Board, Gantt, Calendar, Workload, Timeline, Mind Map, Activity, and more. Custom statuses, custom fields, recurring tasks, dependencies, sprint reporting, and template date remapping are all part of the product. For agencies running 10 similar client engagements per month, template date remapping alone saves hours of manual scheduling work.
Basecamp ships To-dos, Schedules, Card Tables (lightweight Kanban added in 2024), and Hill Charts. The set is small and focused. There is no Gantt chart with cross-task dependencies, no resource workload view, and no formal sprint reporting. Teams that need dependencies and capacity planning will outgrow Basecamp. Teams that want a clean message board and a to-do list per project will find Basecamp easier to live in. See our sprint duration guide for context on which teams actually need formal sprints.
Communication and chat
Both tools ship with chat. ClickUp added native Chat in 2024 and it sits next to tasks and docs in the same workspace. Basecamp has Campfire (group chat per project) and Pings (one-to-one direct messages) baked in since the early days. Both work. Neither is the equal of a chat-first product like Slack or Rock for daily back-and-forth.
The practical difference is around the message board. Basecamp encourages thoughtful written updates instead of rapid-fire chat. The format is closer to email than to Slack, and async-first agencies tend to like it. ClickUp Chat behaves more like a standard team chat product with channels and direct messages. If your team already lives in Slack or WhatsApp, neither tool replaces that. For more on the trade-off, see our asynchronous work guide.
AI in 2026
This is the cleanest wedge between the two products. ClickUp ships ClickUp Brain, an AI add-on at $9 per user per month on top of any paid plan. Brain handles writing assistance, task summaries, project rollups, and meeting transcription. ClickUp also released Super Agents in late 2025, autonomous AI that can execute multi-step workflows.
Basecamp went the opposite direction. 37signals deliberately ships no native AI features. The company experimented internally and chose not to ship most of what they built because it was not actually useful. Their public bet is on agent-accessibility instead. The revamped API and new CLI let external agents like Claude, ChatGPT, or Cursor drive Basecamp from the outside. Users bring their own AI rather than have one chosen for them. If AI is part of how your team works, ClickUp Brain is the more out-of-the-box experience. If you want a tool that does not push you toward AI features, Basecamp is rare in the modern PM market.
Pricing model
ClickUp uses straight per-user pricing on annual billing. Unlimited is $7 per user per month. Business is $12 per user per month. ClickUp Brain (AI) is a separate $9 per user per month add-on. Pricing details on clickup.com/pricing.
Basecamp uses two pricing models in parallel. Plus is $15 per user per month, which favors small teams. Pro Unlimited is a flat $299 per month on annual billing or $349 per month on monthly billing for unlimited users. The flat-rate option becomes the cheaper Basecamp once a team passes 20 people. Pricing details on basecamp.com/pricing. The headline math depends on team size, which is what we model next.
Real cost at 5, 15, 30, and 50 seats
Most ClickUp vs Basecamp articles model 10 seats and stop. Below is the verified annual cost at 5, 15, 30, and 50 seats using 2026 list prices on annual billing. Rock is included as a flat-rate reference because the math gets interesting at the larger sizes.
Team size
ClickUp Unlimited
ClickUp Business
Basecamp Plus
Basecamp Pro Unlimited
Rock Unlimited
5 people
$420
$720
$900
$3,588
$899
15 people
$1,260
$2,160
$2,700
$3,588
$899
30 people
$2,520
$4,320
$5,400
$3,588
$899
50 people
$4,200
$7,200
$9,000
$3,588
$899
Three things stand out. First, ClickUp Unlimited is the cheapest paid option below 12 people. Second, Basecamp Pro Unlimited at $3,588 per year stays flat regardless of team size. That makes it cheaper than ClickUp Business once you pass roughly 25 people, and cheaper than Basecamp Plus once you pass 20. Third, Rock at $899 per year on annual billing is cheaper than both Basecamp options at every team size, and cheaper than ClickUp Business from about 8 people up.
The breakeven math is worth knowing. At 5 people, ClickUp Unlimited at $420 per year wins on price. Past 12 people on ClickUp Unlimited, Rock costs less. Past 20 people, Basecamp Pro Unlimited becomes the better Basecamp option but is still 4 times the cost of Rock. Add ClickUp Brain and the per-user math changes again. AI bundling is a real choice, not a footnote.
None of this matters if the wrong tool is wrong for the work. Pricing alone is a bad reason to switch. But the ClickUp vs Basecamp pricing question, combined with which philosophy fits your team, shapes the decision. For broader cost modeling across PM software, see our best task management apps guide.
When to pick ClickUp
ClickUp is the right pick for teams that want depth and will invest setup time. Some specific cases.
Teams that need Gantt charts, dependencies, and workload views. Basecamp does not ship these. ClickUp does, on the Unlimited plan at $7 per user per month. For agencies running parallel client projects with shifting deadlines, this matters.
Repeatable project work. ClickUp templates include date remapping, which automatically adjusts every due date when you spin up a template for a new project. If your agency launches 10 similar projects per month, this saves hours of manual scheduling. See our ClickUp vs Asana for a deeper PM-side comparison.
Teams that want native AI bundled into the daily flow. ClickUp Brain is the smoother experience for teams that will actually use AI for task summaries, doc drafts, and project rollups.
Teams large enough to assign a champion. The learning curve is real. Without one person owning the setup, ClickUp adoption tends to stall.
Skip ClickUp if. Your team resists complex tools and you cannot dedicate 2 to 4 weeks to setup. You want a tool that works on day one. Or your real friction is chat plus tasks together, not deeper PM features.
When to pick Basecamp
Basecamp is the right pick for teams that want calm, opinionated project management with chat included. Some specific cases.
Async-first agencies and consultancies. The message board format encourages thoughtful written updates instead of rapid-fire chat. Hill Charts give a sense of progress without daily status meetings. The whole product is shaped around how async teams actually work.
Teams that bring clients into projects. Basecamp's client-access mode hides internal threads and gives clients a curated view of project progress. The flow is built in, not bolted on. Agencies that ran into ClickUp's guest-seat complexity tend to find Basecamp a relief.
Teams that prefer no AI baked in. If you want a tool that does not push you to use AI features, Basecamp is rare in the modern PM market. The 37signals stance is a genuine product choice, not marketing.
Teams larger than 20 with a flat-rate preference. Pro Unlimited at $3,588 per year covers any number of users. For a 30-person team, that beats both ClickUp Business ($4,320) and Basecamp Plus ($5,400). Predictable cost matters when budgets are tight.
Skip Basecamp if. You need formal project management with Gantt charts, dependencies, or resource workload views. You want native AI as part of the daily flow. Or your team will outgrow the simple feature set within a year.
Or pick the third option.
Rock combines chat, tasks, and notes in one workspace. Free for small teams.
The honest answer is that neither tool fits every agency. ClickUp wins on depth but adds complexity that takes weeks to land. Basecamp wins on calm but caps out the moment you need real PM. The pattern we see most often at Rock is teams that bought one of these tools and ran into the trade-off. They end up running a chat tool plus a PM tool plus a docs tool side by side.
That is the friction we built Rock to remove. Chat, tasks, and notes in one workspace, with clients and freelancers joining your spaces directly. Flat $89 per month for unlimited users (or $899 per year on annual billing), so a 30-person team pays less than $30 per person per year. Not the right fit if you need Gantt charts and dependencies. Right fit if your real problem is switching between three apps every day.
Rock keeps chat, tasks, and notes inside the same project space. Clients and freelancers join directly without per-seat fees.
FAQ
Is ClickUp or Basecamp easier to use?
Basecamp is easier to use on day one. The interface is opinionated and most teams are productive in a day or two. ClickUp has more features but takes 2 to 4 weeks for the team to feel comfortable. If onboarding speed matters more than feature depth, Basecamp wins this round.
Which is cheaper at scale?
Basecamp Pro Unlimited becomes the cheaper Basecamp option once a team passes 20 people, at a flat $3,588 per year. ClickUp Unlimited stays cheaper than Basecamp Plus at any team size and stays cheaper than Basecamp Pro Unlimited up to about 42 people. ClickUp Business at $12 per user per month catches up to Basecamp Pro Unlimited around 25 people.
Does Basecamp have AI features?
No. 37signals deliberately ships no native AI in Basecamp. They revamped the API and built a CLI in 2025 so external agents can drive Basecamp from the outside. Inside the product itself, there is no AI assistant, no AI summaries, and no AI writing tool.
Does ClickUp have built-in chat?
Yes. ClickUp added native Chat in 2024 and it sits next to tasks and docs. It is functional but not a chat-first product. Most teams that need rich daily chat run a separate messaging tool alongside ClickUp. Basecamp's Campfire chat is older and lighter, and message boards carry most async communication.
Should an agency pick ClickUp or Basecamp?
It depends on the work. Agencies running complex client projects with dependencies, time tracking for billing, and repeatable templates lean ClickUp. Agencies prioritizing client communication, async updates, and minimal training time lean Basecamp. For agencies whose real friction is chat plus tasks together, neither tool is the right answer. See our task management apps guide for the broader category.
The right tool keeps your team focused without adding overhead. Rock combines chat, tasks, and notes in one workspace. One flat price, unlimited users. Get started for free.
Sprint planning is the meeting that opens every sprint. The team picks a goal, pulls work that fits, and commits to a realistic plan. Done well, the next two weeks have a clear north star and the team knows exactly what they are doing on day one.
This guide covers what sprint planning is, the meeting agenda and time-box, the three topics from the Scrum Guide, and how to estimate the work. It walks through the capacity-versus-velocity debate and the common mistakes that turn planning into a status meeting. Drag stories around the live demo below to feel how capacity-based commitment actually works.
Quick Answer: What Is Sprint Planning?
Sprint planning is the time-boxed event at the start of every scrum sprint where the team decides what to deliver and how. The output is a sprint goal, a sprint backlog of selected items, and a plan for delivering them. The Scrum Guide caps it at 8 hours for a one-month sprint, scaled down for shorter sprints. Sprint planning is one of four scrum ceremonies, alongside the daily standup, the sprint review, and the retrospective.
"The sprint planning meeting is successful if everyone exits the meeting with a smile, and wakes up the next morning with a smile, and does their first daily scrum with a smile." - Henrik Kniberg, Agile coach, Crisp
Try sprint planning with capacity
Drag stories from Backlog into This Sprint. The capacity bar fills as points add up. Over-commit and it turns red.
Sprint capacity
0 / 25 pts
Backlog0 pts
This Sprint0 pts
Nice planning rhythm. Run sprints this way in a single workspace where stories, chat, and notes live together.
The widget above is the version we hand to teams running sprint planning live. Drag stories from the Backlog into This Sprint and watch the capacity bar fill. The bar turns red when commitment exceeds capacity (25 points in this example) and shifts to a sweet-spot color when you land between 70% and 100% of capacity. That is the planning rhythm you want.
The Sprint Planning Meeting: Agenda and Time-Box
The meeting follows the same shape regardless of sprint length. Most teams run a 90-minute meeting for a two-week sprint. The Scrum Guide allows up to 8 hours for a one-month sprint, but most teams under 10 people finish in well under 2 hours.
Phase
Time
What you do
Why
10 min
Product Owner proposes a sprint goal: one coherent objective for the increment. The team debates and refines it. Without a goal, the rest of planning is just task triage.
What
30 min
The team pulls top backlog items that fit the goal. Each item is checked against the Definition of Ready. Anything ambiguous gets pushed back to refinement instead of pulled into the sprint.
How
40 min
The team breaks each selected item into the work it actually takes. Estimate in story points or hours. Stop when total commitment hits team capacity, not when the backlog runs out.
Commit
10 min
Confirm the sprint goal, the selected items, and the plan are coherent. Anyone who cannot commit raises it now. Date the sprint and timeline the first daily standup.
The Why phase is the most under-spent and the most consequential. Teams that skip directly to "what should we pull in?" produce sprint backlogs without coherence and have no way to make trade-offs mid-sprint. The 10 minutes spent on a sprint goal pays back across the entire sprint.
If you want a head start on the sprint planning agenda above, our free agile sprint planning template drops the same structure into a Rock space ready to fill in.
The Rock sprint planning template you can paste into your own workspace.
The Three Topics: Why, What, How
The Scrum Guide 2020 frames sprint planning around three topics rather than two phases. Each topic answers a different question and produces a different artifact.
Why is this sprint valuable? The Product Owner proposes a sprint goal: a single coherent objective the increment will commit to. A good goal is concrete enough to test against ("ship the new password reset flow end-to-end") and broad enough to allow for unexpected work ("not just one bug fix in that flow").
What can be done this sprint? The team pulls top backlog items that move toward the goal. Each item is checked against the Definition of Ready: acceptance criteria written, dependencies mapped, estimate done, and small enough to fit in the sprint. Items that fail the Definition of Ready get pushed back to refinement.
How will the chosen work get done? The team breaks each selected item into the actual work it takes. Estimate in story points or hours. Stop pulling items when the total commitment hits team capacity. Self-organize who picks up what once the sprint starts. Do not pre-assign every task in the planning meeting.
Inputs and Outputs of Sprint Planning
Sprint planning has clear inputs the team needs before the meeting starts and clear outputs that ship out of the meeting. Skip an input and the meeting drifts into improvised refinement. Miss an output and the sprint starts without direction.
A refined backlog with pre-planning notes is the input every sprint planning meeting needs.
Inputs. A refined product backlog with the top items meeting the Definition of Ready. The team's recent velocity (rolling 3-5 sprint average). The team's actual capacity for this sprint, accounting for who is on holiday or in meetings. The current Definition of Done so the team knows what "complete" looks like.
Outputs. A sprint goal that summarizes what the increment will achieve. A sprint backlog of selected items with estimates. A plan for delivering them, at least for the first few days. The first daily standup scheduled.
PMI's 2018 Pulse of the Profession reported that 52% of completed projects experience scope creep, up from 43% five years prior. Most scope creep traces back to inputs that were not solid at the start: ambiguous acceptance criteria, missed dependencies, no estimate. A working Definition of Ready is the cheapest insurance against the slow drift that ruins sprints.
How to Estimate the Work
Estimation is where most planning meetings stall. The team disagrees, the Product Owner gets impatient, and someone proposes hours-based estimates that nobody believes. Three techniques cover most cases.
Story points with Planning Poker. Mike Cohn popularized Planning Poker in the early 2000s. Each team member privately picks a Fibonacci-like value (1, 2, 3, 5, 8, 13) for the item, then everyone reveals at once. Discrepancies trigger a short discussion, then re-estimate. The collision of independent estimates is the feature, not the bug. It surfaces hidden assumptions early.
T-shirt sizing. Use XS, S, M, L, XL when the items are too rough for points. Best for early backlog refinement, not for sprint commitment. Convert to story points before the planning meeting if you want capacity math to work.
Hours. Some teams use ideal hours instead of story points. Hours are tempting because they sound concrete, but they hide the complexity and uncertainty that points capture. Use hours only if the team's work is genuinely uniform (production support, recurring deliverables) where uncertainty is low.
The point of estimation is not precision. It is shared understanding. If two team members estimate the same story at 3 and 13, the gap reveals different mental models of the work. That conversation is worth more than the final number.
Velocity vs Capacity: How to Decide
The most common planning argument: should the team commit to its average velocity, or to capacity calculated from who is actually available this sprint? Mike Cohn argues capacity should drive sprint commitment, with velocity used only for longer-range release forecasts.
Estimates against capacity, not velocity, decide what fits in the sprint.
The math is simple. If average velocity is 30 points and the sprint is two weeks, you might commit to 30 again by default. But if a developer is on holiday and a designer has half their time in interviews this sprint, the team's actual capacity might be 18 points. Committing to 30 means either burning out the team or carrying half the work into the next sprint.
Velocity is a long-run forecast. Capacity is the commitment input. Use both: velocity for the release plan, capacity for this specific sprint. Most teams that miss sprint commitments are using velocity where they should be using capacity.
The capacity formula most teams converge on: (team-member-days available × focus factor), where focus factor is typically 0.5 to 0.7. Henrik Kniberg's Scrum and XP from the Trenches popularized the 0.5 default. The 0.5 figure assumes that half the team's nominal hours go to meetings, context-switching, and unplanned work. Track actual focus factor for 3-4 sprints and use real data instead of guesses.
Common Sprint Planning Mistakes
The patterns below show up across teams that adopt sprint planning and lose value within one or two sprints. Most are about treating the meeting as a checklist rather than a working session that produces a real commitment.
No sprint goalThe team selects items but never agrees on a single objective. The sprint becomes a collection of unrelated tickets. Without a goal, mid-sprint trade-offs have no anchor and stakeholders cannot tell whether the sprint succeeded.
Pulling unrefined itemsStories enter the sprint without acceptance criteria, dependencies mapped, or estimates done. The team discovers the work mid-sprint and either burns out trying to finish or carries items over. Refinement is a separate ceremony for a reason.
Committing to velocity instead of capacity"We did 32 points last sprint, so we commit to 32 again." Velocity is a long-run forecast. Sprint commitment should account for who is actually available this week, not the average. Mike Cohn calls this the most common planning failure.
Pre-assigning every taskThe Project Lead assigns each task to a specific person during planning. Self-organization dies. Use planning to surface the work and check it fits capacity. Let the team pick up tasks day-by-day during the sprint.
Over-planning the meetingTwo-hour planning sessions for a one-week sprint kill momentum. The Scrum Guide caps planning at 8 hours for a one-month sprint. Most teams need far less. If planning runs over, the backlog was not refined enough beforehand.
Treating planning as a status reportStakeholders attend, get progress updates, and the team never gets to the actual planning. Sprint planning is a working session for the team that does the work, not a status meeting. Stakeholder updates belong elsewhere.
The biggest of these is committing to velocity instead of capacity. The capacity calculation surfaces the holiday week, the contractor wrapping up, the recruiting load on the engineering manager. The velocity number hides all of that. Sprint planning that ignores actual capacity is the upstream cause of most "we missed the sprint goal again" retros.
Sprint Planning for Distributed and Async Teams
Most sprint planning advice assumes everyone is in a room together. Distributed and async teams need a different shape. The agenda is the same, but the meeting structure adapts to time zones and attention.
Distributed sprint planning leans on async pre-work and a tighter live session.
Pre-work in writing. The Product Owner posts the proposed sprint goal and the top backlog items 24 hours before the meeting. Each team member reviews and adds questions or estimates async. The live meeting then handles only items that need real discussion, which cuts the meeting time by 30 to 50%.
One synchronous block, not two. The Scrum Guide allows splitting planning into Why-What and How sessions. For distributed teams, this doubles the time-zone coordination cost. Run one 90-minute session that hits all three topics. Use the saved time for async refinement before and async confirmation after.
Distributed planning is where chat-first tools beat video-first tools. Atlassian's 2024 State of Teams research, covered by Fortune, found 72% of meetings are ineffective and the average professional spends 31 hours a month in unproductive ones. Cutting planning meeting time by half through async pre-work is the single biggest leverage point most distributed teams miss.
What We Recommend
At Rock we run sprint planning as a 90-minute working session pinned inside the project workspace. The output is a note with the sprint goal, the selected items, and the plan, plus tracked tasks with point estimates so the capacity math is visible. The placement updates daily as work moves through the sprint board.
The reason for keeping the plan inside the project workspace is the failure mode otherwise. Sprint plans that live in slide decks or external trackers become decoration. They get reviewed at planning and forgotten when the team is heads-down. A pinned note plus tracked tasks in the same workspace as the team's chat keeps the plan alive when the sprint actually needs it.
Pair this with the broader sprint toolkit. The scrum guide for agencies covers the full framework. The sprint duration guide covers how to pick the right length. The daily standup guide covers the mid-sprint check-in. The retrospective guide covers the closing ceremony. Together they form a complete picture of running scrum sprints.
Pin sprint planning inside the project workspace. Rock combines chat, tasks, and notes in one workspace. One flat price, unlimited users. Get started for free.
Frequently Asked Questions
What are the 4 phases of sprint planning? The four common phases are: set the sprint goal (Why), select backlog items that fit (What), break down the work and estimate it (How), and confirm the commitment (Commit). The Scrum Guide 2020 frames the first three as topics rather than phases. The fourth is implicit but worth making explicit so nobody walks out unsure.
How long should a sprint planning meeting be? The Scrum Guide caps it at 8 hours for a one-month sprint, 4 hours for a two-week sprint, 2 hours for a one-week sprint. Most teams under 10 people finish in well under those caps. If your planning runs longer, the backlog needs more refinement before the meeting, not more time during it.
Who attends sprint planning? The Product Owner, the Scrum Master, and the development team. Stakeholders are not required and usually slow the meeting down by turning it into a status update. The Product Owner represents stakeholder interests during the meeting and brings updates back to them after.
What is the difference between sprint planning and sprint review? Sprint planning happens at the start of the sprint and produces the sprint goal and backlog. The sprint review happens at the end of the sprint and demonstrates the increment to stakeholders. Planning is internal and forward-looking. Review is external and backward-looking.
What are the inputs and outputs of sprint planning? Inputs are the refined product backlog, the team's recent velocity, the team's actual capacity for this sprint, and the current Definition of Done. Outputs are the sprint goal, the sprint backlog of selected items with estimates, and a plan for delivering them.
What are the three questions of sprint planning? The Scrum Guide 2020 frames sprint planning around three topics: Why is this sprint valuable, What can be done this sprint, and How will the chosen work get done. Each topic answers a different question and produces a different artifact.
A stakeholder map sorts everyone with a stake in your project into a simple picture of who matters most and how to engage them. Done well, it prevents the two most common project failures: blindsiding an executive who should have been consulted, and over-communicating with people who only wanted a newsletter.
This guide covers the 4-step process to build one, the methods to choose from (Power-Interest Grid is the default), and the honest failure modes nobody else writes about. The builder below lets you plot a live Power-Interest Grid in under two minutes.
What Is a Stakeholder Map?
A stakeholder map is a visual that plots everyone connected to your project against two or three dimensions that drive how you engage them. The most common version is a 2x2 grid: Power on one axis, Interest on the other. Each person or group goes into one of four quadrants, and the quadrant tells you the engagement strategy. It sits alongside your project management framework as one of the foundational planning artifacts.
The foundation comes from academic work on stakeholder theory. R. Edward Freeman popularized the core definition in 1984.
"A stakeholder is any group or individual who can affect or is affected by the achievement of the organization's objectives." - R. Edward Freeman, Strategic Management: A Stakeholder Approach (1984)
Seven years later, Aubrey Mendelow published the Power-Interest Grid (sometimes called Mendelow's Matrix), which remains the default tool for classifying stakeholders. Other methods like the Salience Model and Onion Diagram exist for specific situations, but 80 percent of project teams only need the grid.
A stakeholder map starts with a list of who matters, then sorts them into engagement quadrants. The same list appears in the Stakeholders section of a project charter.
Build your Power-Interest Grid
Click a stakeholder to cycle it through the quadrants. Each quadrant shows the engagement strategy for the people placed there.
High Power, High Interest
Manage Closely
Engage deeply. Regular one-on-ones, direct decision access.
High Power, Low Interest
Keep Satisfied
Brief updates. Avoid surprises, do not over-communicate.
Low Power, High Interest
Keep Informed
Share progress. Their input often spots issues others miss.
Low Power, Low Interest
Monitor
Minimum effort. Newsletter-level visibility is enough.
Stakeholders (click name to cycle quadrant, double-click to rename)
+ Add stakeholder
0 stakeholders
Copy as textReset
Clarity on who matters most. Rock keeps the stakeholder map next to the tasks and chats that involve each person, so the map stays useful after the workshop ends.
Every stakeholder map goes through the same four steps. The first two are the heavy lifting. Steps three and four are where most teams rush and end up with a map that looks clean but misrepresents reality.
Step 1. Identify stakeholders. List every individual or group with a stake in the project outcome. Go wide. Include the obvious names (client, sponsor, core team) and the less obvious ones (legal, finance, end users, adjacent teams, vendors). A first pass should produce 15 to 25 names for a medium project.
Step 2. Assess power and interest. For each stakeholder, score Power (can they change the outcome, fund it, or kill it?) and Interest (do they care about the result and want to stay involved?). Use high or low for each. Resist the urge to invent medium scores to avoid hard conversations.
Step 3. Plot on the grid. Place each stakeholder in one of four quadrants: Manage Closely, Keep Satisfied, Keep Informed, or Monitor. Clusters are normal. If every name lands in Manage Closely, you have not scored honestly and the map is useless.
Step 4. Define engagement per quadrant. Write one sentence per quadrant covering frequency, channel, and owner. "Weekly one-on-ones with the client (Project Lead owns)" beats "high touch comms." Specificity is what turns the map from a poster into a plan.
Stakeholder Mapping Tools and Methods
The Power-Interest Grid is the default stakeholder mapping tool, but eight methods cover most projects. Pick based on the shape of your stakeholder set, not the method that looks most sophisticated.
After mapping, when you need to clarify who decides, who delivers, and who is consulted on each piece of work.
You are still in identification mode. RACI assumes you already know the stakeholders.
Stakeholder Circle (Bourne)
Power, Proximity, Urgency
Programs and portfolios where stakeholder relationships persist over months. Visualizes the top 15 stakeholders by influence intensity.
One-off projects. The methodology is heavier than a single delivery warrants.
Three-Dimensional Grid (Murray-Webster & Simon)
Power, Interest, Attitude
Change projects where attitude (supportive, neutral, hostile) flips outcomes more than power or interest do. Common in M&A or restructuring.
Stakeholder attitudes are uniform. The third axis adds drawing complexity without analytical gain.
Force Field Analysis (Lewin)
Forces for / against change
Adoption-driven changes where momentum matters more than authority. Lists driving and restraining forces, often with stakeholders behind them.
Authority-driven decisions. The framework analyses forces, not the people who hold them.
If you are unsure, start with the Power-Interest Grid. Run it for 30 minutes with your team. If it feels like power and interest are not the right axes, switch to the Salience Model. Do not try to use all eight methods on the same project. The deeper guides below explain each method in turn so you can pick on shape, not on which method sounds most rigorous.
Aubrey Mendelow introduced the Power-Interest Grid at the 1991 International Conference on Information Systems. The framework plots stakeholders on a 2x2 by their power to influence the project and their interest in its outcome. Four quadrants follow: Manage Closely, Keep Satisfied, Keep Informed, and Monitor.
The grid is the default opening move for most teams because it is fast to run, easy to communicate, and produces clear engagement strategies per quadrant. Skip it when the shape of your stakeholder set is about urgency or legitimacy.
Salience Model (Mitchell, Agle, Wood)
Ronald Mitchell, Bradley Agle, and Donna Wood published the Salience Model in the Academy of Management Review in 1997. The model classifies stakeholders by three attributes (power, legitimacy, urgency), which intersect into seven types from Dormant to Definitive.
The strength is that it captures the politically complex case where a stakeholder has a valid claim but no formal authority. The cost is the three-attribute scoring, which adds time most projects do not need. Use the Salience Model when 2x2 placement feels wrong because the grid misses what makes a stakeholder salient.
Influence-Impact Grid
The Influence-Impact Grid appears in PMI's PMBOK Guide and is often used in change management. The two axes are influence (can shape the outcome) and impact (will be affected by the outcome). Same shape as the Power-Interest Grid, different question.
The model is most useful in change programs where some stakeholders shape the outcome but are not affected, and others are affected but cannot shape it. The fourth-quadrant trap is real: low-influence, high-impact stakeholders are often the ones whose resistance kills the rollout. Skip when influence and impact track together.
Onion Diagram (Alexander)
The Onion Diagram has roots in Suzanne and James Robertson's Mastering the Requirements Process (1999). Ian Alexander popularized it in product and requirements engineering in the early 2000s. Stakeholders sit in concentric rings around the project, from the product itself out to the wider environment (regulators, market, society).
The onion is best for early discovery, when you do not know enough to score stakeholders on power or interest yet. It tells you who might care, not what to do with them. Once the project starts, switch to a 2x2 method.
RACI Matrix
RACI has roots in 1970s consulting practice and is now codified in PMI's PMBOK Guide. It assigns each stakeholder one of four roles per task or decision: Responsible (does the work), Accountable (owns the outcome), Consulted (input invited), Informed (kept in the loop).
Strictly, RACI is not a stakeholder mapping tool. It assumes you already know the stakeholders and now want to clarify who decides what. In practice, teams run RACI right after the Power-Interest Grid: the grid tells you who matters, RACI tells you what role each one plays.
Stakeholder Circle (Bourne)
Lynda Bourne developed the Stakeholder Circle during her doctoral research at RMIT, then published it in Stakeholder Relationship Management (Gower, 2009). The model visualizes the top 15 stakeholders as concentric arcs scaled by power, proximity, and urgency.
The Stakeholder Circle is heavier than a 2x2 and is built for ongoing programs and portfolios where stakeholder relationships persist over months. For a one-off project, it is overkill. For a multi-year client engagement, the circle keeps the team disciplined about who moves the needle each quarter.
Ruth Murray-Webster and Peter Simon published the Three-Dimensional Grid in PM World Today (2006) as an extension of the Power-Interest Grid. The third axis is attitude, broken into supportive, neutral, and hostile.
The cube produces a richer map. A high-power, high-interest, hostile stakeholder is a different problem than a high-power, high-interest, supportive one, even though both sit in the Manage Closely quadrant of a flat 2x2. Use the third dimension when attitude flips outcomes (M&A, restructuring, leadership change). Skip when attitudes are uniform across the stakeholder set.
Force Field Analysis (Lewin)
Kurt Lewin introduced Force Field Analysis in Field Theory in Social Science (1951). The framework lists the driving forces pushing for a change on one side and the restraining forces pushing against it on the other.
Strictly, this is a change-management framework, not a stakeholder map. It earns its place in the toolkit because the forces are usually attached to specific stakeholder groups, which reframes the conversation away from authority and toward momentum. Use Force Field when the project is an adoption play. Skip when the question is "who has the authority to greenlight this."
Stakeholder Map Template
Our strategy template library includes planning frameworks, and the same principles apply to a stakeholder map. You need three artifacts: the list, the grid, and the engagement plan per quadrant. Here is the minimum structure any tool can produce.
Stakeholder list. A row per stakeholder with columns for name, role or title, power score (high or low), interest score (high or low), and assigned quadrant. This is the raw data the grid visualizes.
The grid itself. A 2x2 with Power on the vertical axis and Interest on the horizontal. Each quadrant holds the names that scored into it. The builder above produces this automatically from the list.
Engagement plan. One row per quadrant with columns for frequency, channel, owner, and key message. This is what turns the grid into actual behavior change.
Worked Example: Website Redesign
Here is a filled stakeholder map for a 6-week website redesign. Real reasoning per placement, not placeholder labels.
A filled stakeholder map for a real project looks more like a shared plan than a framework exercise.
High power, high interest
Manage Closely
Client CMO signs the budget and cares about traffic numbers; biweekly syncs. Project Sponsor owns the outcome internally and sits in planning. Both get weekly one-on-ones with the Project Lead.
High power, low interest
Keep Satisfied
CEO approved the project but trusts the CMO to run it. Cares only that it ships on time. Monthly two-paragraph update via email. No meeting.
Low power, high interest
Keep Informed
Design Lead shapes the work daily but cannot override the brief. Content Team cares deeply because they maintain the copy after launch. Both get weekly detailed updates.
Low power, low interest
Monitor
External developer contractor bills hourly and executes the brief. Spec plus a Slack ping when scope shifts. Newsletter-level visibility is enough.
That is 5 roles across 4 quadrants. Real projects often have 10 to 20 stakeholders. The logic scales because the engagement strategy per quadrant is fixed. Only the names change.
When Mapping Is Useful (and When It Is Theater)
Stakeholder mapping works when the project meets three conditions: it involves 5 or more stakeholders, spans multiple weeks, and has at least one stakeholder whose engagement will make or break the outcome. If any of those is missing, mapping adds ceremony without clarity.
The cost of skipping the exercise is rarely visible at kickoff and almost always visible at month three. PMI's 2013 Pulse of the Profession found that 56% of every dollar at risk on a project comes down to ineffective communications. Most of that risk traces back to stakeholders who were never properly identified or engaged.
Skip mapping on solo or small-team projects. Under 5 stakeholders, everyone knows who cares about what. A formal grid is overhead.
Skip mapping on short projects (under 2 weeks). The time to build and maintain the map exceeds the value. A one-line "owner per deliverable" note is enough.
Skip mapping on projects with one dominant stakeholder. When one client or one executive drives everything, the map is a single quadrant with everyone else in Monitor. Do not dress that up as analysis.
The most common theater pattern: teams build the map in a kickoff workshop, post it to a wiki, and never reference it again. A stakeholder map is a living document. If you do not update it when someone leaves, joins, or shifts priority, the map is stale within a month.
How to Run a Stakeholder Mapping Workshop
A good stakeholder mapping workshop takes 60 minutes with 4 to 8 people from the project team. Inviting every stakeholder defeats the purpose. You are assessing them, not negotiating with them.
Sticky notes per stakeholder, placed silently first, then debated in round two.
Phase
Time
What you do
Prep
15 min before
Project Lead pre-lists 15 to 25 candidate stakeholders. Share the list 24 hours ahead so people form opinions beforehand. Bring a blank 2x2 grid on a whiteboard or shared doc.
Round 1: Individual placement
10 min
Each person silently places every stakeholder into a quadrant. Use sticky notes if in person, or a shared canvas if remote. No discussion yet.
Round 2: Debate conflicts
25 min
For each stakeholder where placements disagreed, discuss. Disagreements are signal, not noise. They usually reveal that team members have different relationships with that person.
Round 3: Commit to engagement plan
10 min
Assign an owner per quadrant. Write one sentence per quadrant covering frequency and channel. Date the map. Schedule a 30-minute review in 4 weeks.
Teams that run this workshop at project kickoff and revisit it monthly have fewer last-minute stakeholder blow-ups than teams that skip it or do it once.
From Map to Execution
The hardest part of stakeholder mapping is not building the map. It is making the map influence daily behavior after the workshop ends. Most stakeholder maps become wiki artifacts that nobody consults when a decision needs their input. Pin the map plus an engagement plan next to the project work, not in a separate slide deck.
The fix is to keep the stakeholder map close to the tasks and conversations it governs. If the map lives in one tool, the project runs in another, and the client chat lives in a third, the map will rot. Teams that co-locate their stakeholder map with their stakeholder communication, RACI matrix, and project plan keep it alive because they see it daily.
What we see on Rock. Teams that use Rock to run client projects keep the stakeholder map as a pinned note in the project space. The quadrant assignments become follower lists on tasks.
Manage Closely stakeholders get added as followers on milestone tasks. Keep Informed stakeholders get added to the weekly status note. Monitor stakeholders only see the final launch announcement.
That way the map is not a separate document to maintain. It is the routing logic that decides who sees what.
Frequently Asked Questions
Is a stakeholder map the same as a stakeholder matrix? Mostly yes. Most teams use the terms interchangeably. "Map" tends to describe the output (the 2x2 with names placed), and "matrix" tends to describe the method (the framework with axes and quadrants). When someone asks for a stakeholder matrix, they almost always mean the Power-Interest Grid.
How often should I update a stakeholder map? Monthly for projects over 3 months. Biweekly for projects under 3 months. Every time someone joins or leaves the project, update the map the same day.
What if a stakeholder does not fit cleanly in one quadrant? Put them in the higher of the two. A borderline high-power stakeholder goes into Manage Closely or Keep Satisfied, not Keep Informed. The cost of under-engaging is higher than over-engaging.
Do I need special software to build a stakeholder map? No. A whiteboard or a shared doc is enough. The tool does not matter. What matters is that the map stays near the tasks and conversations it governs.
What are the 4 quadrants of stakeholder mapping? The four quadrants come from the Power-Interest Grid. They are Manage Closely (high power, high interest), Keep Satisfied (high power, low interest), Keep Informed (low power, high interest), and Monitor (low power, low interest). Each quadrant maps to its own engagement strategy.
What is the difference between stakeholder analysis and stakeholder mapping? Stakeholder analysis is the broader practice of identifying stakeholders and understanding their interests, influence, and likely behavior. Stakeholder mapping is one technique within that practice, specifically the visual placement of stakeholders on a 2x2, onion diagram, or other framework. Mapping is the deliverable; analysis is the underlying work.
What are the 5 stakeholder analysis methods? The five most common are the Power-Interest Grid, the Salience Model, the Influence-Impact Grid, the Onion Diagram, and the Stakeholder Circle. Most strategic toolkits add RACI, the Three-Dimensional Grid, and Force Field Analysis as related techniques, which is why this guide covers eight.
Why is stakeholder mapping important? Stakeholder mapping prevents the most common project failure mode: discovering halfway through that a critical stakeholder was unmanaged. It forces the team to name everyone affected, score their power and interest, and assign engagement before the project encounters resistance. Skipping the exercise is cheap at kickoff and expensive at month three.
Stakeholder maps only work if they stay close to the work. Rock combines chat, tasks, and notes in one workspace so your stakeholder map, your project plan, and your client conversations live together. One flat price, unlimited users. Get started for free.
This month we shipped four updates: an AI-friendlier public API, a full Spanish interface, sharper space search, and a sweep of UX and stability fixes across web, desktop, and mobile.
Here is what is new.
AI-Friendly Public API
Rock has had a public API for a while. This month we expanded it with the building blocks AI assistants need to act inside your spaces.
The result: you can connect ChatGPT, Claude, Gemini, or any AI assistant, and have it create tasks, send messages, post updates, or pull context from a space. All from a simple conversation.
Claude spinning up a new client project from a brief, straight inside a Rock space.
What that looks like in practice:
Use case
What your AI does in the space
Project kickoff from a brief
Drop a client brief in the space and ask your AI to read it. It breaks the work into tasks, assigns them, and sets the sprint.
Status TL;DR of a space
Coming back from PTO or jumping into a busy space? Ask your AI to read the recent messages, tasks, and notes, and post a summary of where each project stands.
Daily standup recap
Your AI scans yesterday's activity each morning and posts a recap: what shipped, who is blocked, what is next.
Dev updates from Claude Code
Hook Claude Code into your engineering space so it posts when it opens a PR, finishes a build, or pushes a deploy. No more copy-pasting from GitHub.
Client emails to tasks
Paste a long client email and your AI creates the right tasks, with deadlines and owners. No more manual breakdown.
Weekly client recaps
End of the week, your AI scans the space and drafts a status message you can send to the client. Copy, edit, send.
How to set it up
Setup takes minutes. From inside the space you want to plug your AI into:
1. Open Space settings from the space header.
2. Go to Integrations, then Custom Webhook.
3. Click Add new to generate a bot token. (Custom webhooks are part of the Unlimited plan.)
4. Hand the token to your AI assistant. It can now read and act inside that one space, not your whole workspace.
It works the same way MCP connections work in Claude: your AI gets direct access to a single space at a time.
Bring your own key. No per-seat AI fees, no vendor lock-in. Unlike platforms that charge extra for proprietary AI, Rock lets your team use whatever AI they already pay for.
We are actively expanding what the API can do. If there is a workflow you want to automate but cannot yet, let us know.
Rock en Español
Rock is now available in Spanish. The full interface, notifications, and onboarding flow have been translated for Spanish-speaking teams.
Latam is one of our fastest-growing regions, with agencies and small businesses across Mexico, Argentina, Colombia, and Spain running their work on Rock. Until now, those teams worked in English. Now they can work together and with clients in both English or Spanish.
To switch your language: open your user settings, select Language, and toggle to Spanish.
This is our first step toward making Rock accessible to more teams around the world. More languages are on the way. Want to request a language? Poke us in the support space.
Rock now speaks Spanish across the entire workspace.
Sharper Space Search
Space search is now faster and more accurate. Whether you are looking for a message, a task, or a file from a few weeks back, results surface where you expect them.
UX, UI, and Stability
We rolled out a batch of small improvements across the platform: visual refinements, performance updates, and stability fixes on web, desktop, and mobile.
Nothing flashy. Just smoother day-to-day use.
What's Next
This is the start of a busier release cadence for Rock. Over the next few months we will keep expanding the API and shipping the improvements our users ask for most.
Have a feature request or a bug to flag? Ping us in the Rock Support and Updates space. We read every message, and the things you raise shape what we build next.
The Power-Interest Grid is the stakeholder-mapping framework most project teams reach for when they need a fast answer to "who do we engage how?" It plots every stakeholder on a 2x2 grid: power on one axis, interest on the other. The resulting quadrant tells you whether to manage them closely, keep them satisfied, keep them informed, or just monitor.
This guide covers what the Power-Interest Grid is and the two dimensions that drive placement. It walks through the four quadrants and their recommended strategies, how to apply the grid in five steps, and the mistakes that turn a useful framework into a slide nobody opens. Use the Power-Interest Builder widget below to map your own project's stakeholders.
The Power-Interest Grid is a 2x2 stakeholder mapping tool that classifies stakeholders by their power to influence outcomes and their interest in the project. The four quadrants are Manage Closely (high power, high interest), Keep Satisfied (high power, low interest), Keep Informed (low power, high interest), and Monitor (low power, low interest). The framework was introduced by Aubrey Mendelow in 1991 and is often called Mendelow's matrix.
"Stakeholder mapping is a planning concept emphasizing organizational responsiveness to those who hold power over and interest in the project's outcome." - Aubrey Mendelow, Environmental Scanning: The Impact of the Stakeholder Concept (1991)
Run it at project kickoff and re-run it at every phase gate, then set an engagement cadence for each quadrant.
Origin and Why It Works
Mendelow developed the framework while working at Kent State University in the late 1980s, and presented it at the Second International Conference on Information Systems in Cambridge, MA in 1991. He was responding to the same gap that R. Edward Freeman's 1984 stakeholder theory had identified: organizations had stakeholder lists but no way to prioritize. Freeman defined stakeholders as broadly relevant; Mendelow gave practitioners a tool to decide who deserved attention this quarter.
"A stakeholder is any group or individual who is affected by or can affect the achievement of an organization's objectives." - R. Edward Freeman, Strategic Management: A Stakeholder Approach (1984)
Freeman's definition is the upstream theory; Mendelow's grid is the downstream practical tool. Most stakeholder analysis today uses both. Freeman's broad definition identifies everyone. Mendelow's grid prioritizes. PMI's Project Management Institute curriculum, MBA programs, and corporate change management all teach the pair together.
The framework's persistence is mostly about its simplicity. Two binary scores produce four cells with clear engagement strategies. You can run it in 20 minutes with sticky notes. The trade-off is loss of nuance: the Salience Model's three attributes capture stakeholder dynamics the 2x2 cannot. Use the Power-Interest Grid as the first-pass filter and a more granular framework for high-stakes work.
When to Use the Power-Interest Grid
The grid earns its place in three specific moments. First, at project kickoff, to set engagement strategy before the team commits to a stakeholder communication plan. Second, before any major scope or contract change, when the stakeholder landscape may have shifted. Third, when a project hits a politically tense moment and the team needs a defensible map of who matters.
It is less useful in three other situations. Solo or two-person projects do not have enough stakeholders to justify the grid; the prioritization is obvious. Highly regulated work (pharmaceutical trials, public-sector tenders, financial audits) needs the Salience Model's urgency dimension because regulatory deadlines drive priority more than power or interest alone. And projects with complex coalition dynamics need a relationship-focused framework like Aaltonen and Kujala's multilateral salience extension; the 2x2 cannot capture how stakeholders interact with each other.
For most agency, marketing, product, and IT projects in the 5 to 50-person team range, the Power-Interest Grid is the right first-pass tool. Run it at kickoff, re-run at every phase gate, and add a more granular framework only when the stakes warrant the extra detail. The cost of skipping the exercise is rarely visible at kickoff and almost always visible at month three, when an unmanaged stakeholder surprises the project.
The 2 Dimensions: Power and Interest
The whole framework rests on two binary dimensions. Get either definition wrong and the placements drift; get both right and the quadrants almost place themselves.
Power. The stakeholder's ability to influence the project's outcome. Power can be formal (org-chart authority, budget control, regulatory authority, contract signoff) or informal (coalition leadership, media reach, technical veto). A stakeholder has power if they can make the project change direction, slow down, or stop.
Interest. How much the stakeholder cares about the project's outcome. Distinct from power: a CEO has high power across every project but high interest only in some. A frontline operator has low formal power but high interest if the project changes their daily work. Interest measures attention and emotional stake, not authority.
The most common conceptual mistake is collapsing interest into influence. A stakeholder can be highly interested without being able to influence the outcome, and the framework only works if you keep the two dimensions independent.
Power-Interest Grid Builder
Type each stakeholder, then click the quadrant where they belong: Manage Closely (high power, high interest), Keep Satisfied (high power, low interest), Keep Informed (low power, high interest), Monitor (low power, low interest). The grid below updates as you click.
Low interest
High interest
Power ↑
High power, low interest
Keep Satisfied
High power, high interest
Manage Closely
Low power, low interest
Monitor (minimum effort)
Low power, high interest
Keep Informed
Interest →
0 placed
The widget above is the version we hand to project teams running this exercise live. Add stakeholder names, click the quadrant where each belongs, and the grid populates as you go. The pre-filled "Project sponsor" example demonstrates the Manage Closely quadrant; the empty row below it is where you start your own.
The 4 Quadrants and Recommended Strategy
Each quadrant maps to a specific engagement strategy. Mendelow's original framing assumed organizations would respond differently to stakeholders by quadrant; the strategies below are the modern, project-management formulation refined across thirty years of practice.
Quadrant
Profile
Strategy
Examples
Manage Closely
High power, high interest
Top priority. Engage actively, involve in decisions, communicate frequently. These stakeholders can make or break the project.
Project sponsor, executive committee, key client decision-maker, regulator with active jurisdiction
Keep Satisfied
High power, low interest
Keep informed but do not overwhelm. Maintain confidence; activate them when key decisions need their backing.
Senior executives outside the project, board members, parent-company finance, major shareholders
Keep Informed
Low power, high interest
Keep them in the loop with regular updates. They lack authority but care deeply; can become advocates if engaged well.
End users, dedicated team members, community groups, niche customer cohorts
Monitor
Low power, low interest
Minimum effort. Periodic check-ins. Watch for any change in their power or interest that would push them up the grid.
Adjacent teams not directly affected, general public, media not actively covering the project
The most under-managed quadrant is Keep Satisfied. High-power-low-interest stakeholders feel safe to ignore until they suddenly care, at which point they have the power to disrupt and no relationship history with the team. A monthly executive briefing is cheap insurance.
The most over-managed quadrant is Keep Informed. Project teams default to high-touch engagement with anyone who shows interest, even when the stakeholder has no power. The right move is regular updates (newsletters, digests, dashboards) without consuming the team's bandwidth. Save the high-touch engagement for Manage Closely.
How to Apply the Power-Interest Grid in 5 Steps
The mechanics are straightforward; the discipline is in scoring power and interest independently and re-running the grid as the project changes. Five steps separate teams that get value from teams that produce a static slide.
List the stakeholdersPull names from the project charter, the org chart, contracts, regulators with jurisdiction, end-users, vendors. Aim for 10 to 25 names. The grid will sort them; the job at this stage is exhaustive identification.
Score each stakeholder on powerPower is the ability to influence the project's outcome, formally or informally. Use a binary high/low decision unless you have rich data; binary forces a clearer conversation than 1-to-10 scoring.
Score each stakeholder on interestInterest is how much the stakeholder cares about the outcome. Distinct from power: a CEO has high power across every project but high interest only in some. Be specific to this project; the same person can sit in different quadrants on different work.
Place each in one of the four quadrantsManage Closely (high power, high interest), Keep Satisfied (high power, low interest), Keep Informed (low power, high interest), Monitor (low power, low interest). The Power-Interest Builder above does this directly: type the name, click the quadrant, see the grid populate.
Set engagement cadence per quadrantManage Closely gets weekly touchpoints and decision-involvement. Keep Satisfied gets monthly executive updates. Keep Informed gets weekly newsletters or digests. Monitor gets quarterly check-ins plus a trigger to escalate if power or interest changes.
The fifth step (engagement cadence per quadrant) is where most failures happen. Identifying who is in Manage Closely is easy; defining what weekly engagement actually means (a 30-minute call? a written update? a co-decision in the steering committee?) is the work. Pin the cadence to the calendar with named owners.
Use the Rock Stakeholder Engagement Plan template as the starting point for cadence per quadrant.
Power-Interest Grid vs Other Stakeholder Frameworks
The Power-Interest Grid is one of several stakeholder frameworks, each answering a different question. The table below shows where each fits in your stakeholder toolkit.
Framework
Dimensions
Best for
Power-Interest Grid
Power x Interest (2x2, 4 quadrants)
Quick segmentation by attention level; setting engagement strategy by quadrant
Mapping proximity to the work; useful for communication frequency planning
The pragmatic stack we recommend works in layers. Use the Stakeholder Map first to identify everyone visually. Run the Power-Interest Grid for fast 2x2 prioritization. Layer on the Salience Model when you need finer-grained prioritization (especially for the Manage Closely quadrant). Use the RACI matrix separately for decision rights on the engagement plan.
Common Mistakes
The patterns below show up across teams that adopt the Power-Interest Grid and lose the value within one or two project phases. Most are about treating the framework as a static slide rather than a live operating exercise.
Confusing interest with influenceInterest is "how much do they care about this outcome?" Influence is part of power: "can they affect the outcome?" Many articles collapse the two and end up with a Power-Influence grid, which is meaningless. Mendelow's distinction is the whole point; keep them separate.
Scoring the person, not the situationA CEO has high power across every project but high interest only in some. Score each stakeholder against this specific project, not their general organizational role. The same person sits in different quadrants on different work.
Treating placement as staticPower and interest both shift. A regulator with no current claim is a Monitor; the same regulator after a public incident is Manage Closely overnight. Re-run the grid quarterly and after any significant change in scope, regulation, or context.
Ignoring the Keep Satisfied quadrant until it is too lateHigh-power-low-interest stakeholders feel safe to ignore, right up until they suddenly care. Then they have the power to disrupt and no relationship history with the team. A monthly briefing is cheap insurance against this exact failure mode.
Treating Monitor as "do nothing"Monitor is the lightest engagement, not zero engagement. Quarterly check-in plus a trigger condition (what would push them to a higher quadrant) keeps the watch list useful. Without that trigger, low-power-low-interest stakeholders escalate before anyone notices.
Building the grid alone, not with the teamPower-Interest scoring works better with three or four perspectives in the room. The PMs who run this exercise solo consistently misjudge interest levels, especially for technical or operational stakeholders. Run it as a 30-minute team session, not as homework.
The biggest is the static placement trap. The whole point of the framework is that placement can change as the project unfolds. A regulator who is currently in Monitor can move to Manage Closely overnight after a public incident. Run the exercise quarterly at minimum, plus after every material context change.
What We Recommend
At Rock we run the Power-Interest Grid as a 30-minute team exercise pinned inside the project workspace. The output is a note with the four-quadrant placement, named owners per Manage Closely and Keep Satisfied stakeholder, and an engagement cadence written next to each name. The placement updates at every phase gate; tasks for each engagement live in the same workspace as the project work.
The reason for keeping the grid inside the project workspace is the failure mode otherwise. Stakeholder maps that live in slide decks become decoration; they get reviewed at kickoff and forgotten when the team is heads-down. A pinned note with the current grid plus tracked tasks for each engagement keeps the model alive when the project actually needs it.
Pair this with the broader stakeholder toolkit. The Stakeholder Map handles visual planning. The Salience Model handles finer-grained 7-type prioritization. The RACI matrix handles decision rights. Our stakeholder communication guide covers the cadence of how you engage each priority tier.
Pin the Power-Interest Grid inside the project workspace. Rock combines chat, tasks, and notes in one workspace. One flat price, unlimited users. Get started for free.
Slack and Google Chat compete for the same job, but they approach it from opposite directions. Slack treats chat as the workspace and pulls everything else in through integrations. Google Chat treats chat as one layer inside Google Workspace, sitting next to Gmail, Drive, Calendar, and Meet. The choice often comes down to which side of that fence your team already lives on.
This guide compares Slack and Google Chat axis by axis, then runs the real cost at 5, 15, 30, and 50 seats. It also covers the late-2025 Google Chat catch-up that most ranking comparison articles still miss. Some teams should pick Slack. Some should pick Google Chat. And some should pick neither because they need chat plus tasks plus notes in one workspace, not just chat. Run the recommender below for a starting point.
Slack puts chat at the center and treats everything else as a deep integration. Google Chat does the opposite, sitting inside the Google Workspace ecosystem.
Quick answer. Slack is the chat-first option, Salesforce-owned, and has the deepest integration directory in the category at 2,600+ apps. Google Chat is bundled with Google Workspace and shines for teams that already use Gmail, Drive, and Meet. Pick Slack if your team values polish and integration breadth. Pick Google Chat if you already pay for Workspace and want chat next to your inbox. Pick neither if you want chat with tasks and notes in one workspace, at flat pricing, without the per-seat tax.
Want chat plus tasks?
Rock pairs messaging with tasks and notes in one workspace. One flat price.
Slack launched in 2013 and made channels and threaded chat the default for team communication. Salesforce acquired the company in 2020. The product has stayed close to the original idea: chat is the workspace, and everything else is a deep integration on top.
The 2026 feature set covers channels, threads, group huddles, Canvas (collaborative documents inside Slack), Lists (lightweight project tracking), and Slack Connect for cross-organization channels. Slackbot is now context-aware, pulling answers from channels, canvases, and Salesforce records when grounded with permissions. Agentforce agents run inside Slack threads for sales and support workflows. The integration directory has 2,600+ apps, the deepest in the category by a wide margin.
"Slack wins on UI and has a better chat flow. Google Chat wins in price, integrations, and audio/video capabilities." - Reddit user, cited in Connecteam's Google Chat vs Slack review (2026)
The Reddit framing captures the buyer experience. Most teams that have tried both come away with the same conclusion. Slack feels nicer to use day to day. Google Chat is good enough and meaningfully cheaper if you already pay for Workspace. The honest comparison is not which is "better" in the abstract. It is which trade-off matches your team.
The big 2025 shift was AI pricing. Slack killed the standalone Slack AI add-on (which was $10 per user per month) and bundled the same features into every paid tier mid-year. So Pro, Business+, and Enterprise+ all now include AI message summaries, channel recap, and search-grounded answers as part of the base price. This makes the Slack vs Google Chat cost comparison more direct than articles published before May 2025 suggest.
Google Chat is the messaging layer inside Google Workspace. Originally launched as Hangouts Chat in 2017, then rebranded to Google Chat in 2020, the product spent the last few years catching up to Slack on features. The core value proposition stayed the same. Tight integration with the rest of Google Workspace at no extra cost on most paid plans.
The current feature set covers spaces (the Slack-channels equivalent), threads, direct messages, group DMs, and the new Huddles feature for ad-hoc audio and video conversations. Spaces can hold up to 500,000 members. Gemini integration runs in a side panel inside Chat for summaries, action items, and grounded answers. Late in 2025, Google Chat became a data source in the Gemini app, which means Workspace users can query Chat content directly from Gemini.
Google Chat sits inside Google Workspace. The fit is seamless if your team already lives in Gmail, Drive, and Meet.
"Chat integrates seamlessly with Gmail, Calendar, Drive, Meet, and other Google Workspace apps which makes it easy for us to use all in one workspace." - G2 reviewer, Google Workspace
That review captures Google Chat's main strength. The integration with the rest of Google Workspace is unmatched. Gmail messages can convert into Chat threads. Drive files preview inline. Calendar events become Meet meetings in one click. For a team already standardized on Workspace, the friction to adopt Chat is close to zero.
The 2026 release pushed AI deeper into the product. Gemini in the side panel can summarize long conversations, extract action items, draft replies, and answer questions about the channel history. Translation is automatic across multilingual teams. The Gemini integration is included in Workspace Business Standard and higher tiers, with no separate per-user surcharge for the chat-grounded features.
Where Google Chat struggles is outside the Workspace ecosystem. The third-party app directory exists but is shallower than Slack's, with around 100 apps versus Slack's 2,600+. External users can join shared spaces but the experience is less polished than Slack Connect. And the depth of customization (channel templates, workflow builder, custom slash commands) is more limited than Slack offers.
Slack vs Google Chat side-by-side
Six axes matter when picking between these tools in 2026. Channels and threading, video and audio, AI strategy, integrations, security and compliance, and pricing. Here is how each one stacks up.
Feature
Slack
Google Chat
Owned by
Salesforce (since 2020)
Google (part of Google Workspace)
Built around
Channels and threaded chat as the workspace
Messaging layer inside Google Workspace
Best for
Chat-first SaaS teams, Salesforce-stack companies
Teams already on Google Workspace
Channels and threads
Strong, mature threading model
Spaces and threads, simpler model
Video and audio
Huddles for ad-hoc calls in all paid tiers
Huddles launched late 2025 in DMs and spaces; Google Meet for scheduled calls
AI in 2026
Slack AI bundled in all paid tiers; Agentforce agents
Gemini in side panel; Chat is now a Gemini data source
Integrations
2,600+ apps in directory; deepest ecosystem
Deep Google Workspace integration; ~100 third-party apps
Free plan
90-day message history, limited integrations, no group huddles
Free with personal Gmail; limited features for business use
Paid from
Pro $7.25/user/mo (annual)
Bundled with Workspace Business Starter $7/user/mo (annual)
Higher tier
Business+ $12.50/user/mo
Workspace Business Standard $14/user/mo (annual)
Lock-in
Salesforce orbit and integration ecosystem
Google Workspace dependency (full Google stack)
External users
Slack Connect for cross-org channels (mature)
External users via shared spaces, less polished
Mobile
Strong, near desktop parity
Strong, especially inside Workspace ecosystem
Channels and threading
Slack wins on threading depth and channel polish. Threads were a first-class feature from the early days. The pattern is well established: a channel holds the conversation flow, and threads keep replies organized so a fast-moving channel does not bury context. Mature teams build cultures around threading discipline.
Google Chat threads work, but the model is simpler and the conventions less developed. Spaces can be threaded or unthreaded at creation time, which is a one-way choice. The threading experience inside spaces is functional but less polished than Slack's. For teams coming from Gmail conventions (long-form messaging, reply-all chains), Google Chat's flatter structure can feel more familiar.
Both tools support direct messages, group DMs, mentions, and reactions. The basics are at parity. The difference is in how teams actually use channels day to day.
Video and audio
Both tools now offer ad-hoc audio and video. Slack Huddles have been around since 2021 and are mature. Google Chat Huddles launched in late 2025, fully rolled out by early 2026. Both let participants click a phone icon in any DM, group chat, or space to start a quick audio call, with optional video and screen-sharing.
For scheduled meetings, Google Chat hands off to Google Meet, which is a full meeting platform with recording, transcription, and breakout rooms. Slack does not bundle a scheduled-meeting platform at the same depth, so most Slack-using teams pair it with Zoom or Google Meet for formal meetings. If your team runs heavy meeting volume and wants chat plus video in one tool, Google Chat plus Meet is the tighter combination.
For teams that prefer async-first work and use video sparingly, both options work fine. See our Zoom vs Google Meet comparison for the standalone meeting tool decision.
AI strategy in 2026
This is where the two products diverge meaningfully. Both have native AI, but the scope and pricing model differ.
Slack went all-in on bundling AI into base plans. At $7.25 per user per month on Pro, you get message summaries, channel recap, search-grounded answers, and Canvas AI editing. Agentforce agents extend this for Salesforce-stack teams. There is no separate AI add-on cost.
Google Chat uses Gemini, which comes bundled with Google Workspace Business Standard and higher tiers. Gemini in the side panel can summarize threads, generate action items, refine messages, and translate across languages. In late 2025, Google Chat became a data source for the Gemini app, which means Workspace users can query Chat content from anywhere in the Gemini interface. The bundling means there is no separate AI fee on top of Workspace pricing.
Slack AI is more focused on chat-internal workflows. Google's Gemini is broader and grounded across the full Workspace corpus (Gmail, Drive, Docs, Sheets, Calendar, Meet). For teams already on Workspace, Gemini's reach is wider. For chat-only AI use cases, Slack's implementation is more mature.
Integrations
Slack wins on breadth. The integration directory has over 2,600 apps including most major SaaS tools (Salesforce, Jira, GitHub, Zoom, HubSpot, Notion, Linear, Figma). The integrations are typically deeper than what Google Chat offers, because Slack has been the default chat tool for SaaS-first companies for a decade.
Google Chat has a smaller third-party app directory of around 100 apps. The native integrations with the rest of Google Workspace are unmatched. Gmail, Drive, Calendar, Meet, Docs, Sheets, and Forms all connect natively. AppsScript and Apps Script automation work inside Chat for custom workflows. For teams that live in Workspace, the depth of native integration often beats what they would get from a third-party Slack app.
For a team that lives in SaaS tools, Slack's directory is a real productivity advantage. For a team that lives in Workspace, Google Chat's native integrations are an advantage in the other direction. The question is which ecosystem your team already runs on.
Security and compliance
Both tools cover the major enterprise compliance certifications. Google Chat inherits Google Workspace's compliance surface (HIPAA, FedRAMP Moderate, GDPR, SOC 2, ISO 27001). Slack covers similar certifications on Enterprise+ tier, plus additional industry-specific options.
For organizations not in regulated industries, the difference rarely matters in practice. For organizations that ARE in regulated industries, the procurement question often comes down to which platform your IT team is already comfortable provisioning. If you are already running Workspace, adding Chat is zero-friction. If you are running a different stack, Slack Enterprise+ or Microsoft Teams may be the easier procurement path.
Pricing tiers
Slack uses straightforward per-user tiers. Pro is $7.25 per user per month on annual billing. Business+ is $12.50 per user per month. Enterprise+ is custom (typically $15 or more). All paid tiers include Slack AI as of mid-2025. Pricing details on slack.com/pricing.
Google Chat is bundled with Google Workspace plans. Workspace Business Starter is $7 per user per month annual ($8.40 monthly), which includes Chat plus Gmail, Drive (30 GB), Calendar, Meet (up to 100 participants), and basic security. Business Standard at $14 per user per month annual includes 2 TB of storage, Meet recording, and Gemini AI features. Business Plus at $22 includes Vault and advanced security. Pricing details on workspace.google.com.
Both vendors raised prices in 2025, with Google's increase tied to the addition of Gemini AI features. The math depends on team size and what you actually use. For chat-only use, Workspace Business Starter at $7 is the cheapest paid path. For teams that want full Gemini features, Business Standard at $14 is the typical sweet spot.
Google Chat 2026 catch-up: Huddles, Gemini, and the rebrand
Most ranking comparison articles still describe Google Chat as it was in 2023 or 2024. Three things have changed materially since then.
First, Huddles. In late 2025, Google launched Huddles in Google Chat. Click the phone icon in any DM, group chat, or space and start a quick audio call. Participants join with one tap. Video and screen-sharing turn on optionally. This closed the biggest functional gap with Slack, which has had Huddles since 2021. Many older comparison articles still cite Google Chat's lack of native voice and video as a Slack advantage. In 2026, that gap is gone.
Second, Gemini in Chat became a data source. As of February 2026, Workspace customers can query Google Chat content directly from the Gemini app. The Gemini side panel inside Chat had been there for over a year. The new piece is bidirectional: Chat threads inform Gemini's answers across the rest of Workspace, not just inside the Chat interface. For Workspace-native teams, this makes Chat content first-class in their AI workflows.
Third, the long Hangouts-to-Chat migration finished. Classic Hangouts was deprecated in 2022, and the rolling migration to the new Chat completed in 2024. The product that ranks against Slack in 2026 is genuinely different from the Hangouts product that lost the chat-tool comparison fights in 2018-2020. The branding consolidation and feature parity push has been steady, and the pricing bundle has stayed competitive.
The freshness of these developments is itself an advantage when evaluating older comparison content. Many top-ranking articles still cite Slack-only-has-Huddles or Google-Chat-lacks-AI as decisive. In 2026, neither is true. The comparison is closer than the SERP suggests.
Real cost at 5, 15, 30, and 50 seats
Most comparison articles model 10 seats and stop. Below is the verified annual cost at 5, 15, 30, and 50 seats using 2026 list prices on annual billing. Google Chat pricing assumes the relevant Workspace plan since most buyers do not run Chat as a fully standalone product. Rock is included as a flat-rate reference for the chat-tool category.
Team size
Slack Pro (incl. AI)
Slack Business+ (incl. AI)
GW Business Starter
GW Business Standard
Rock Unlimited
5 people
$435
$750
$420
$840
$899
15 people
$1,305
$2,250
$1,260
$2,520
$899
30 people
$2,610
$4,500
$2,520
$5,040
$899
50 people
$4,350
$7,500
$4,200
$8,400
$899
Three things stand out. First, Slack Pro and Google Workspace Business Starter are within $35 a year of each other across all sizes. The "Slack is more expensive" framing is mostly outdated. Second, the bigger gap shows up at the higher AI tier. Slack Business+ at $12.50 versus Workspace Business Standard at $14 is a small per-user difference, but Workspace Standard adds 2 TB storage, Meet recording, and the broader Gemini features. Third, Rock at $899 per year on annual billing crosses the breakeven line around 11 to 12 people for both Slack and Google Chat.
The breakeven math: at 5 people, Slack Pro ($435) and Workspace Business Starter ($420) are both about half of Rock ($899). Past 12 people on either Slack Pro or Workspace Starter, Rock starts to cost less. At 30 people, Rock at $899 is a third of Slack Pro's $2,610 or Workspace Starter's $2,520. At 50 people, the gap is dramatic enough to fund a part-time role with the savings.
None of this matters if Slack or Google Chat is the right tool for the work. Pricing alone is a bad reason to switch. But the math becomes part of the conversation as teams grow past 15 people. For broader cost modeling against the wider category, see our task management apps roundup.
When to pick Slack
Slack is the right pick for teams that lead with chat and want the deepest integration ecosystem. Some specific cases.
SaaS-first companies and startups. If your stack is built on tools like Salesforce, HubSpot, GitHub, Jira, Linear, Figma, or Notion, Slack's integration directory delivers the deepest connections in the category. Most modern SaaS tools have a Slack integration before they have a Google Chat one.
Teams already in the Salesforce orbit. Slack plus Salesforce gives you Agentforce agents inside chat, channel access to CRM records, and unified search across both. For sales-heavy organizations, the integration is meaningful.
Teams that prioritize threading and channel discipline. Slack's threading model is the most mature in the category. Teams that depend on async work and channel-based information architecture will feel at home faster than they would on Google Chat's simpler structure.
Cross-org collaboration with external partners. Slack Connect is the most polished cross-organization chat in the category. Working with clients, vendors, or partners who use Slack themselves is much smoother than the equivalent in Google Chat.
Skip Slack if. You already pay for Google Workspace and your team mostly uses Gmail, Drive, and Meet. You want a single bill for chat plus email plus storage plus video. Or your team is on a tight budget and the per-user math at scale is a problem.
When to pick Google Chat
Google Chat is the right pick for teams already standardized on Google Workspace. Some specific cases.
Teams already on Google Workspace. If your team uses Gmail for email, Google Drive for files, Google Calendar for scheduling, and Google Meet for video, Chat sits inside the same workspace with zero adoption friction. The integration is unmatched and the learning curve close to zero. Buying Chat separately when you already pay for Workspace makes no sense.
Small to mid-sized teams that want one bill. Workspace bundles email, calendar, file storage, video, and chat into one subscription. For a 10 to 30 person team, $7 to $14 per user per month covers most of the collaboration stack. Adding Slack on top of that bill is duplicative for most teams.
Teams that need video as a first-class feature. Google Meet is a full meeting platform with recording, transcription, breakout rooms, and now AI-generated summaries. Combined with Chat Huddles for ad-hoc calls, the video experience inside Workspace is comprehensive without any third-party add-on.
Teams that want AI grounded across the full Workspace. Gemini in Workspace can answer questions across Gmail, Drive, Docs, Sheets, Calendar, Meet, and Chat. For knowledge workers whose context lives across multiple Workspace tools, that grounding matters more than chat-only AI features.
Skip Google Chat if. Your team is not on Google Workspace. You are SaaS-first and want the deepest third-party integration directory. You depend on threading discipline and channel polish that Slack does better. Or you do regular cross-org work with clients on Slack and Slack Connect would solve a real problem.
That third option, simply.
Rock combines chat, tasks, and notes. Built for client work, free for small teams.
The Slack vs Google Chat question hides a third question: is chat alone the right tool, or do you need chat plus tasks plus notes in one workspace? Slack and Google Chat are both chat-first products. They do not bundle real task management or document collaboration. So most teams using either pair it with a separate project management tool (ClickUp, Asana, Monday, Trello, Notion) and a separate document tool. Three tools, three bills, three places where information lives.
The Harvard Business Review study on app toggling found that knowledge workers switch apps up to 1,200 times per day, losing roughly four hours a week to context switching. Stacking Slack on top of a PM tool on top of a doc tool makes that number worse, not better. For agencies and growing teams that pull clients and freelancers into the work, the per-seat math on guest access compounds the cost.
Rock falls into the chat-with-tasks-and-notes category. Every project space includes its own chat, task board, notes, and file storage. Pricing is flat at $89 a month for unlimited users, or $74.92 a month on the annual plan, which works out to $899 per year. For a 25-person team, that is $36 per person per year, less than three months of Slack Pro at the same headcount. Clients and freelancers join spaces directly without per-seat fees, which solves the cross-organization access tax that bites both Slack Connect and Google Chat external-user setups.
Rock is not the right tool for everyone. If your team is 100+ people and needs full enterprise compliance, Microsoft Teams or Slack Enterprise+ is a safer pick. If your team lives in Salesforce and needs Agentforce agents inside chat, Slack is the better fit. If your team has standardized on Google Workspace and the integration cost of switching is high, Chat plus Workspace stays the easier path. Rock fits the chat-first growing team that wants tasks and notes in the same workspace, at flat pricing, without the per-seat tax. That is a real subset of teams, but not the universal answer.
For teams that want to test the chat-first workspace model on real work, Rock's free plan covers 3 group spaces with 5 members each. That is enough to run a project end to end. Compare against your current Slack or Google Chat plus PM tool plus doc tool monthly cost. The math at 15 or more people is hard to argue with. See our WhatsApp vs Slack vs Rock comparison and the Rock vs Slack page for the wider chat-first context.
FAQ
Is Slack better than Google Chat? Neither is universally better. They are built around different stacks. Slack is the stronger pick for teams outside the Google ecosystem, especially Salesforce-stack and SaaS-first companies. Google Chat is the stronger pick for teams already on Google Workspace and for organizations that want one bill for chat plus email plus storage plus video. The right choice depends on what your team already runs on.
Is Google Chat free? The personal version of Google Chat is free with a regular Gmail account. The business version is bundled with paid Google Workspace plans starting at $7 per user per month annual. Workspace Business Starter is the cheapest paid option that includes Chat for business use. There is no standalone "Google Chat for Business" SKU sold separately from Workspace.
Which is cheaper, Slack or Google Chat? Per-user pricing is close. Slack Pro is $7.25 per user per month annual. Google Workspace Business Starter is $7 per user per month annual. The Google Chat bundle includes Gmail, Drive (30 GB), Calendar, and Meet, which Slack does not. If your team already pays for Workspace, Chat is effectively free. If you are choosing chat alone, the costs are within $35 a year of each other for a 10-person team.
Does Slack have AI? Yes. Slack AI was a $10 per user per month add-on through 2024. In mid-2025, Slack killed the add-on and bundled the features into every paid tier. So Pro, Business+, and Enterprise+ all include AI summaries, channel recap, search-grounded answers, and Canvas AI editing as part of the base price. Agentforce agents (Salesforce-integrated) are available for compatible setups.
Does Google Chat have AI? Yes, through Google Gemini. Gemini in the side panel of Chat can summarize conversations, generate action items, refine messages, and answer questions about chat history. As of February 2026, Google Chat is a data source for the Gemini app, which means Workspace users can query Chat content from the broader Gemini interface. Gemini features are bundled with Workspace Business Standard and higher tiers, with no separate AI add-on cost.
Does Google Chat have Huddles or video calls? Yes. Google Chat Huddles launched in late 2025 and rolled out fully by early 2026. Click the phone icon in any DM, group chat, or space to start a quick audio call. Video and screen-sharing turn on optionally. This closed the biggest functional gap with Slack. For scheduled meetings, Chat hands off to Google Meet, which is a full meeting platform with recording, transcription, and breakout rooms.
Can Slack and Google Chat talk to each other? Not natively. There are third-party bridge tools (Mio, Cloudfuze) that synchronize messages between the two platforms, but the experience is imperfect. Most organizations that need both end up running them in parallel for different use cases (Workspace for internal Google-stack work, Slack for client channels and SaaS integrations).
What about teams of 5 to 15 people that do not need much? Both Slack and Google Chat have entry-level tiers that work fine for small teams. Slack Free caps at 90 days of message history but covers DMs, channels, basic integrations, and one-on-one huddles. Google Workspace Business Starter at $7 per user per month is cheap enough for small teams and includes the rest of Workspace. For a 5 to 15 person team, the choice usually comes down to which ecosystem you are already on.
Want one workspace where chat, tasks, and notes live together? Rock combines all three with flat pricing for unlimited users. Get started for free.
Jira is a project and issue tracking tool from Atlassian, originally built in 2002 as bug-tracking software for developers. It is now positioned as the dominant work management platform for agile software teams. If you have ever opened a ticket marked "blocker," joined a sprint planning meeting, or seen a backlog measured in story points, you have likely seen Jira at work.
This guide covers what Jira actually does, how the three Jira products differ, what it costs in 2026, and where it genuinely shines or breaks down. The goal is an honest take, not a marketing pitch.
Jira is the agile-first heavyweight. Most teams comparing it to alternatives are weighing depth and customization against simplicity and time-to-value. Here is a quick read of the field as of 2026.
Tool
Best For
Free Plan
Paid From
Jira
Agile dev teams, complex workflows
10 users
$7.91/user/mo
Rock
Chat + tasks, flat pricing
3 spaces, 5 members
$89/mo flat
ClickUp
All-in-one, deep customization
Unlimited members
$7/user/mo (AI extra)
Asana
Structured projects, Goals
10 users
$10.99/user/mo
Trello
Visual Kanban, simple workflows
10 collaborators per board
$5/user/mo
The choice usually comes down to two questions. How agile-mature is your team, and how much config time can you absorb before the tool earns its keep? If both answers are "very," Jira is hard to beat. Otherwise, simpler tools usually fit better.
What Jira actually does
Jira tracks work in units called issues. Issues can be bugs, user stories, tasks, or sub-tasks. Issues group into epics (larger bodies of work) and live inside projects. Teams move issues through customizable workflows on boards (Scrum, Kanban, or custom), break the work into sprints, and report progress through dashboards and burndown charts.
Atlassian sells three Jira products, all under the "Jira" brand as of 2026:
Jira Software. The flagship: agile project management for software development teams. Issues, sprints, backlogs, releases, version tracking, integrations with Bitbucket and GitHub.
Jira Service Management. ITSM and customer support workflows. Service request portals, incident management, SLA tracking, change management. Used by IT teams and increasingly by ops/HR.
Jira Work Management. The general-team version of Jira, blended into the main Jira brand in 2026 Atlassian positioning. Lighter views (lists, calendars, timelines) for marketing, ops, HR, and other non-engineering teams.
"Atlassian exists to unleash the potential in every team." - Mike Cannon-Brookes and Scott Farquhar, Atlassian Co-founders
The original Jira pitch was narrower: a better bug tracker for software teams. The platform has expanded steadily, and Atlassian's 2026 positioning emphasizes AI integration through their Rovo assistant, with workflows that connect to Confluence, Bitbucket, and 10,000+ apps in the Atlassian Marketplace. Whether that breadth is a feature or a complexity tax depends on the team using it.
Want a simpler alternative?
Rock pairs tasks with chat and notes in one workspace. One flat price, unlimited users.
Jira runs on per-user, per-month subscriptions. The free tier is generous for small teams; the Standard plan is the most common entry point; Premium adds cross-project automation and stronger security features. The full Atlassian pricing page covers the latest tier breakdown.
Jira Standard
What it costs as your team grows
$7.91/user/mo
Monthly cost
$119/mo
$1,424 per year
515 users200
Annual billing. Free for up to 10 users. Premium tier is $14.54/user/month with cross-project automation. Enterprise pricing is custom.
For reference, a flat-priced alternative like Rock is $89/mo regardless of team size ($5.93/user at this size).
The single biggest practical decision point: the free tier caps at 10 users. Teams that grow past 10 jump to Standard ($7.91/user/month) and the math changes fast. A 25-person team pays roughly $2,375/year on Standard. Premium doubles that. For comparison, Jira's free tier is the most generous in the agile-tools space, but the cliff at 10 users is what catches most growing teams.
If your team is 8-10 people today and likely to add 3-5 more this year, factor the cliff in upfront. Picking Jira and then watching the bill triple at month 11 is one of the more common regrets we see in PM tooling decisions.
Where Jira excels
Agile depth. Jira is built for Scrum and Kanban from the ground up. Sprint planning, backlog grooming, story points, velocity tracking, burndown charts: all native. No PM tool matches Jira's depth on agile ceremonies and reporting.
Workflow flexibility. Custom workflows with conditional transitions, validators, and post-functions let large teams encode their actual process in the tool. Combined with automation rules, Jira can replicate complex multi-stage approval processes that simpler tools cannot.
Integration depth. The Atlassian Marketplace has 10,000+ apps. Native integrations with Confluence (docs), Bitbucket (code), and increasingly with GitHub, Slack, Figma, and AI tools. For software teams already in the Atlassian ecosystem, the integration cost is near zero.
Reporting and dashboards. Real-time burndown, velocity, sprint reports, control charts, cumulative flow. Jira's reporting is more granular than any PM-tool peer. Engineering managers and program leads use this depth daily.
The honest trade-offs
The same depth that makes Jira powerful for mature agile teams makes it heavy for everyone else. The most-cited critiques from 7,500+ G2 reviews are remarkably consistent.
Steep learning curve. Jira's G2 ease-of-setup score is 7.5/10, the lowest in mainstream PM tools. First-time admins typically need 2-4 hours of configuration before their team can use it productively. Compare with Trello or Monday.com, where a team is moving cards within 10 minutes of signup.
Cluttered UI and slow page loads. Larger Jira instances feel sluggish. Important updates get buried in long ticket histories. Reviewers consistently mention the navigation feels overwhelming for occasional users.
Overkill for small teams. The setup cost only pays back at scale. For teams under 10 people, the time spent configuring Jira is often more than the time saved by using it.
"Too many people use Jira's breathtakingly incorrect definitions of story, epic, and task. It is one way that using Jira distorts your process away from agility." - Allen Holub, Software Architect and Agile Author
Holub's point is the deepest critique of Jira. The tool can shape, and sometimes distort, how teams think about agile work. The defaults are baked-in opinions about what a "story" or "epic" is. Teams that adopt Jira without examining those defaults end up with the tool driving the process instead of the other way around.
Jira's defaults are opinions about how agile work should look. They reward teams that match those opinions and frustrate teams that do not.
Or skip the learning curve.
Rock works out of the box: tasks, chat, and notes with no admin setup required. Free for small teams.
Jira is the right pick when four conditions line up. Your team is software development. You run formal Scrum or Kanban. You have someone comfortable maintaining the tool. And you have more than 10 people. The depth pays back at scale and the integrations slot into existing dev workflows.
Pick something else if any of these apply. Your team is under 10 people and likely to stay there. You do not run formal agile ceremonies. Your team is non-technical (marketing, ops, HR). Or you cannot dedicate someone to admin and configure the tool. Lighter alternatives like Rock, Trello, or Asana usually fit those teams better. For the head-to-head comparisons, see ClickUp vs Jira, Asana vs Jira, and Trello vs Jira.
"Picking Jira when your team is under 10 people is the same mistake as picking ClickUp when you are under 5. The tool's complexity outpaces the team's actual needs. Match the tool to where you actually are, not where you think you might be in two years." - Nicolaas Spijker, Marketing Expert
Jira earned its position as the agile gold standard for a reason: nothing else matches the depth at scale. The catch is that "at scale" is doing a lot of work in that sentence. For most teams under 10, or non-engineering teams of any size, the cost of complexity outpaces the value. Match the tool to your team, not to the wishful org chart.
If Jira's complexity feels heavier than the work itself, a flat-priced workspace might fit better. Rock combines tasks, chat, and notes in one place, with cross-org collaboration and no per-seat tax. Get started for free.
The Salience Model is the framework most project managers reach for when too many stakeholders compete for attention and the team has to decide who matters right now. Three yes/no attributes (power, legitimacy, urgency) classify each stakeholder into one of seven types, and the type tells you whether to engage immediately, monitor, or filter out for now.
This guide covers what the Salience Model is and the three attributes that drive classification. It walks through the seven stakeholder types and how to engage each one. It also includes comparisons to other stakeholder frameworks and the mistakes that turn a good model into a static slide. Use the Salience Builder widget further down to map your own project's stakeholders.
The Salience Model is a stakeholder-prioritization framework that classifies stakeholders by three attributes: power, legitimacy, and urgency. It was introduced by Ronald Mitchell, Bradley Agle, and Donna Wood in their 1997 paper Toward a Theory of Stakeholder Identification and Salience, published in the Academy of Management Review. Stakeholders with all three attributes are Definitive (highest priority). Those with two are Expectant. Those with one are Latent. Salience is dynamic, so the classification needs re-running as the project context shifts.
The model fills a specific gap in stakeholder analysis. The Stakeholder Map is great for plotting everyone visually. The RACI Matrix is great for decision rights. The Salience Model is the priority lens that answers "if I can only call three stakeholders before the next meeting, who?"
Origin and Why It Works
Mitchell, Agle, and Wood developed the Salience Model in response to a specific problem in 1990s stakeholder theory. Earlier work (Freeman, 1984) defined stakeholders broadly as anyone affected by an organization's actions. That definition was inclusive but useless for prioritization: managers ended up with stakeholder lists of 30 or 40 names and no way to decide whose claim mattered most this quarter.
The 1997 paper solved this by introducing three observable attributes that combined to produce a salience score. The classification turned the abstract question "who is a stakeholder?" into the concrete one "who deserves attention right now, and why?" The model has been cited over 16,000 times in academic literature and is part of the Project Management Institute's standard stakeholder analysis toolkit. Its persistence is mostly due to the binary attribute design: yes/no questions force a clearer decision than 1-to-10 scoring scales.
The model is most useful in projects with many stakeholders and limited engagement bandwidth. Construction, public-sector projects, healthcare, and complex agency engagements are typical settings; for a 5-person internal initiative with three stakeholders, the framework adds overhead without much insight.
The 3 Attributes
The whole framework rests on three binary attributes. Each stakeholder either has the attribute or does not, and the combination determines the type.
Power. The stakeholder can influence the project's outcome, formally (org-chart authority, budget control, regulatory authority) or informally (coalition leadership, media reach, a coercive option). Power is "can they make us do something we would otherwise not do?"
Legitimacy. The stakeholder's claim is appropriate within the project's social, legal, or contractual context. Legitimacy does not require formal authority; a community affected by a planned development has legitimacy even without an org-chart title. Legitimacy is "do they have a reasonable basis to be heard?"
Urgency. The stakeholder's claim is time-sensitive or critical to them. Urgency has two parts: time pressure (regulatory deadline, contractual due date) and criticality (the issue matters intensely to the stakeholder). Urgency is "if we wait, does this become much worse?"
Salience Builder
Type a stakeholder name in each row, then toggle which of the three attributes each one holds: power (can influence outcomes), legitimacy (claim is appropriate), urgency (time-sensitive). The widget classifies each into one of seven types. Add rows below, copy the map when done.
Tip: Definitive stakeholders (all three attributes) deserve highest priority. Latent types (one attribute) need monitoring; their claim can escalate quickly if a second attribute becomes true.
0 stakeholders mapped
Solid map. Pin this list in your project workspace and assign owners for the Definitive and Dangerous stakeholders first.Try Rock for free
The widget above is the version we hand to project teams that want a working salience map in 5 minutes. Add stakeholder names, toggle the three attributes, and the widget classifies each into one of the seven types with an engagement hint. Reset to the example to see a worked map.
The 7 Stakeholder Types
The combinations of three binary attributes produce eight possibilities; subtract the "no attributes" case (non-stakeholder) and you have seven actionable types. Mitchell, Agle, and Wood group them into three tiers: Latent (one attribute), Expectant (two), and Definitive (all three).
Type
Attributes
Example
How to engage
Definitive
PowerLegitimacyUrgency
Project sponsor demanding a feature for a board deadline
Top priority. Immediate, sustained engagement; resolve the claim or escalate.
Dominant
PowerLegitimacy
Compliance team, executive committee, regulator without imminent deadline
Keep informed and aligned; they expect engagement and have means to insist.
Dangerous
PowerUrgency
Hostile press contact during a crisis; coercive lobbying group
Watch closely. Without legitimacy, may use coercion; address fast or risk disruption.
Dependent
LegitimacyUrgency
End-users awaiting a critical fix; community impacted by a project deadline
Their claim is valid and pressing but they lack power. Advocate or pair with a powerful ally.
Dormant
Power
Influential industry figure with no current claim against your project
Monitor. Can become Dominant or Dangerous quickly if their claim becomes legitimate or urgent.
Discretionary
Legitimacy
Long-term industry partner with general interest in the project
Engage selectively. No urgent need, but the relationship matters long-term.
Demanding
Urgency
Vocal social-media critic with no formal authority or obvious legitimacy
Acknowledge. Risk of becoming Dangerous if they gain power or legitimacy; do not ignore.
The most common mistake at this stage is over-investing in Latent types and under-investing in Dangerous ones. Latent stakeholders matter, but they are watch-list items, not active engagements. Dangerous stakeholders (power plus urgency, no legitimacy) are the ones who blow up projects in the news cycle. Their lack of legitimacy means they are willing to use coercion. Their power and urgency mean they have the means and motivation to do it now.
How to Engage Each Stakeholder Type
Classification without an engagement plan is paperwork. Each of the seven types needs a different posture, cadence, and owner. The patterns below are what we run on agency and project work; adapt to your context but keep the principle that engagement effort should match salience.
Definitive (all three attributes). Top priority. The project sponsor or regulator with imminent claims gets immediate, sustained engagement. Named owner at executive level. Weekly or daily touchpoints. Resolve the claim or escalate; do not let it sit.
Dominant (power plus legitimacy). Keep informed and aligned. Compliance team, executive committee, anchor client. Monthly steering committee at minimum, plus immediate escalation when scope or risk changes. They expect to be engaged; missing them creates trust damage.
Dangerous (power plus urgency). Watch closely; address fast. Hostile press contact, lobbying group, coercive vendor. Defensive engagement: clear, prompt, on-record responses. The goal is to prevent escalation and avoid giving them legitimacy through public conflict.
Dependent (legitimacy plus urgency). Advocate for them. End users awaiting a fix, communities affected by a project deadline. Pair them with a powerful ally inside the organization who can act on their behalf. Without that ally, their valid claims go unmet.
Dormant, Discretionary, Demanding (one attribute each). Watch list. Quarterly check-in or trigger-based monitoring. The trigger is the missing attribute: a Dormant stakeholder who suddenly has a legitimate claim becomes Dominant; a Demanding stakeholder who picks up power becomes Dangerous. Track the trigger conditions explicitly.
"Stakeholders' salience emerges from their interactions, not from individual attributes alone." - Aaltonen and Kujala, A multilateral stakeholder salience approach (2010 / 2021 extension)
Aaltonen and Kujala's extension to the original model is worth absorbing. Stakeholders rarely act alone; coalitions form, alliances shift. A Dormant stakeholder paired with a Demanding one can produce the equivalent of a Dangerous coalition without either party crossing a threshold individually. Track the relationships between stakeholders, not just their individual scores.
"Gaining and maintaining the support and commitment of stakeholders requires a continuous process of engaging the right stakeholders at the right time." - Lynda Bourne, Stakeholder Relationship Management
Bourne's framing is the practical complement to Mitchell's theory. Salience tells you who; Bourne's continuous-engagement principle tells you that the work is never done. The model classifies; the engagement plan operationalizes.
Salience Model vs Other Stakeholder Frameworks
The Salience Model is one of several stakeholder frameworks, and it answers a specific question. The table below shows where each framework belongs in your stakeholder toolkit.
Mapping proximity to the work; useful for communication frequency planning
The pragmatic stack we recommend works in three steps. Use the Stakeholder Map first to identify everyone visually. Then run the Salience Model to set priority among them. Then use a RACI matrix to assign decision rights on the engagement plan. Three frameworks, three different questions answered.
How to Apply the Salience Model in 5 Steps
The mechanics are straightforward; the discipline is in keeping the attributes binary and re-running the model as the project changes. Five steps separate teams that get value from the framework from teams that produce a static slide nobody opens.
List every stakeholder, not just the obvious onesPull names from the project charter, the org chart, regulators with jurisdiction, vendors, customers affected, internal teams downstream. Aim for 15 to 25 names on the long list. The Salience Model will filter; the job at this stage is exhaustive identification.
Score each on power, legitimacy, and urgencyMark each stakeholder yes/no on the three attributes. Power means they can influence the outcome (formally or informally). Legitimacy means their claim is appropriate within the project's social and legal context. Urgency means time sensitivity or critical importance to them.
Classify into the 7 typesThree attributes equal Definitive (top priority). Two equal Expectant (Dominant, Dangerous, or Dependent). One equals Latent (Dormant, Discretionary, or Demanding). Zero means non-stakeholder for now. The Salience Builder above does this classification automatically.
Decide engagement strategy per typeDefinitive and Dominant get sustained, high-touch engagement. Dangerous get fast, defensive attention. Dependent get advocacy from a powerful ally. Latent types stay on a watch list with a trigger condition (what would push them up to Expectant?).
Re-run the model when the project shiftsSalience is dynamic. A public incident can convert a Dormant stakeholder into Dangerous overnight; a coalition can convert Demanding into Dominant. Re-run the classification at least once per project phase, plus after any major change in scope, regulation, or external context.
The fifth step (re-running the model) is the one most teams skip. Salience is dynamic by design: a public incident, a coalition forming, a new regulation, a vendor failure can all change the classification overnight. Calendar a quarterly re-run plus a trigger-based one whenever the project's context shifts materially.
Common Mistakes
The patterns below show up across teams that adopt the Salience Model and lose value within one or two project phases. Most are about treating the framework as a slide deck rather than an operating exercise.
Confusing legitimacy with formal authorityLegitimacy is whether the claim is appropriate within the project's social and legal context. It does not require an org-chart title. A community group affected by a planned facility has legitimacy even without formal authority; ignoring them produces Dependent stakeholders that escalate to Dangerous.
Treating salience as staticSalience changes. A regulator with no current claim is Dormant; the same regulator with a public incident on file is Definitive overnight. Run the classification as a quarterly or per-phase exercise, not a one-time mapping.
Ignoring Demanding stakeholdersDemanding stakeholders (urgency only) get dismissed because they lack power and legitimacy. Mistake: they are one coalition or one news cycle away from gaining either. Acknowledge them; the cheap response now prevents the expensive one later.
Over-engineering the scoreSome teams turn the three yes/no attributes into 1-to-10 scales and weighted formulas. The model loses its bite when over-quantified. The yes/no version forces a clearer decision; binary attributes are the point of the framework.
Skipping the engagement-action stepIdentifying Definitive and Dangerous stakeholders without writing down who owns the relationship and what the engagement cadence is leaves the work undone. Each Expectant or Definitive stakeholder needs a named owner and a defined touchpoint frequency.
Using Salience without a complementary frameworkSalience tells you who matters most right now; it does not tell you what each person should DO on the project. Pair with a RACI matrix for decision rights and a Stakeholder Map for engagement strategy across the long tail. Salience is the priority lens, not the whole stakeholder system.
The biggest of these is treating salience as static. The whole point of the model is that the classification can change as the project unfolds; if your map is a one-time exercise from kickoff, you are managing yesterday's stakeholders. Re-run quarterly at minimum, and after every material context change.
What We Recommend
At Rock we run the Salience Model as a recurring 30-minute exercise pinned inside the project workspace. The output is a note with the seven-type classification. Each Definitive and Expectant stakeholder gets a named owner. Each Latent stakeholder gets a trigger condition (what would push them up the priority ladder). The classification updates at every phase gate, and tasks for the engagement plan live in the same workspace as the project work.
The reason for keeping the salience map inside the project workspace is the failure mode otherwise. Stakeholder maps that live in slide decks become decoration; they get reviewed at the start of the project and forgotten when the team is heads-down on delivery. A pinned note with the current map plus tracked tasks for each engagement keeps the model alive when it actually matters.
Pin the salience map inside the project workspace. Rock combines chat, tasks, and notes in one workspace. One flat price, unlimited users. Get started for free.
Most sales dashboards track 12 to 15 metrics across pipeline, activity, conversion, and revenue. The honest answer is that a B2B sales team only needs about six numbers, and one composite metric (Sales Velocity) compresses the whole engine's health into a single signal. Tracking 15 metrics in isolation produces noise; tracking the right six tells the team where to focus next.
This guide covers the six sales KPIs that actually predict revenue, with benchmarks for each. It introduces the auto-calculated Sales Velocity formula that turns four of those numbers into one headline output. The Health Check widget further down lets you plug your numbers in and see your dollars-per-day result.
Sales KPIs are the small set of metrics that connect sales activity to revenue outcomes. The six that matter for most B2B teams are quota attainment, pipeline coverage ratio, win rate, average sales cycle length, average deal size (ASP), and lead response time. Sales Velocity is the auto-calculated composite that combines four of those into a dollars-per-day output.
"Defining the sales methodology enables the sales training formula to be scalable and predictable." - Mark Roberge, The Sales Acceleration Formula
These metrics arrange in a hierarchy rather than a flat list. Pipeline coverage feeds win rate, win rate plus ASP feeds Sales Velocity, and Sales Velocity predicts whether quota attainment will land. Track the six in their proper layers and start with Sales Velocity as the headline number.
The 6 Sales KPIs That Predict Revenue
Each of the six below has a specific job. Together they tell you whether the engine is healthy, where it is leaking, and how much revenue it produces per day. The composite (Sales Velocity) is the headline; the inputs are where the team focuses to move it.
Quota attainment. The percentage of quota the team or rep achieves in a period. Healthy is 80% or higher across the team; below 65% is a process problem, not an effort problem. This is the board-level scorecard; track it monthly.
Pipeline coverage ratio. Qualified pipeline value divided by quota. The healthy band is 3x to 4x; below 2x means the team is mathematically unlikely to hit number this quarter regardless of how good closers are. Watch it weekly. This is the leading indicator that runs ahead of quota attainment.
Win rate by segment. Closed-won deals divided by total opportunities. B2B SaaS mid-market typically lands at 20% to 30%; SMB closes higher (often 30%+), enterprise lower (8% to 15%). Always segment; a blended company-wide win rate hides which motion is working and which is not.
Average sales cycle length. Days from opportunity created to closed-won. The healthy band for B2B SaaS is 46 to 75 days; longer cycles eat working capital, shorter cycles often mean qualification is loose. Cycle length is a velocity input: shorter cycles, all else equal, mean more revenue per quarter.
Average deal size (ASP). Total closed revenue divided by deals won. The SaaS median sits around $26,000 per the latest benchmark data, but ASP varies wildly by segment and motion. ASP is context, not a band; what matters is whether it is moving the way the strategy expects (up if you are moving upmarket, stable if you are scaling SMB).
Lead response time. Time from inbound lead arrival to first sales touch. Healthy is under 5 minutes; the conversion multiplier is real and large. Published research finds responding in 5 minutes vs 30 minutes is a 5x to 21x increase in conversion to qualified opportunity. Most teams know this and still let response time drift to hours. Build the alert into the workflow.
"Lead generation is what drives growth; salespeople are simply a conduit for that growth." - Aaron Ross, Predictable Revenue
Ross's framing is why pipeline coverage outranks closer skill on this list. A team with great closers and a 1.5x pipeline coverage will miss number every quarter; a team with average closers and a 4x coverage will hit consistently. The pipeline is the engine; the closing is the conversion of fuel into miles.
Benchmarks at a Glance
The table below shows healthy, watch, and fix bands for each of the six KPIs. Use it as starting calibration; B2B SaaS specifics are drawn from public benchmark data, and bands shift by segment and stage.
KPI
What it measures
Healthy
Watch
Fix
Quota attainment
Percent of quota the team or rep achieves in a period
80% or higher
65% to 80%
Below 65%
Pipeline coverage ratio
Qualified pipeline value divided by quota
3x to 4x
2x to 3x
Below 2x
Win rate
Closed-won deals divided by total opportunities, segmented
20% to 30% B2B SaaS
12% to 20%
Below 12%
Average sales cycle length
Days from opportunity created to closed-won
46 to 75 days B2B SaaS
30 to 100 days
Above 100 days
Lead response time
Time from inbound lead arrival to first sales touch
Under 5 minutes
5 to 30 minutes
Above 30 minutes
Sales Velocity
(Opportunities x win rate x ASP) / cycle length, expressed as $/day
Trending up quarter-over-quarter
Flat
Trending down
Two cautions on the bands. First, win rate ranges assume mid-market B2B SaaS as the baseline; SMB-only teams should expect higher (30%+), enterprise-only teams should expect lower (8% to 15%). Second, sales cycle length is shorter for self-serve and product-led teams (often 7 to 30 days) and longer for complex enterprise (90 to 180+ days). Compare against your own historical baseline before comparing against industry averages.
Sales KPI Health Check
Type your numbers and see where each one sits against B2B SaaS benchmarks. The auto-calculated Sales Velocity is the headline number that tells you how much revenue your engine produces per day.
Quota attainment (team avg)
Healthy: 80% or higher across the team
%
Type
Pipeline coverage ratio
Healthy: 3x to 4x of quota
x
Type
Win rate (B2B SaaS, mid-market)
Healthy: 20% to 30% by segment
%
Type
Average sales cycle length
Healthy: 46 to 75 days B2B SaaS
days
Type
Average deal size (ASP)
SaaS median: about $26K (varies by segment)
$
Type
Lead response time
Healthy: under 5 minutes; the conversion multiplier
min
Type
Sales Velocity (the headline number)opportunities x win rate x ASP / cycle length-
Type pipeline coverage, win rate, ASP, and cycle length to see your dollars-per-day output.
0 of 6 healthy
Solid sales engine. Track Velocity weekly alongside the inputs that move it.Try Rock for free
The widget above is the version we hand to teams that want to see how their inputs combine into Sales Velocity. The auto-calculated dollars-per-day output is the headline; the input rows tell you which lever to pull first. A 20% lift in pipeline coverage moves Velocity by 20%; cutting cycle length from 75 to 60 days moves Velocity by 25%. The widget makes those tradeoffs visible at a glance, which is the point.
Vanity Metrics Sales Teams Confuse for KPIs
Three numbers show up on most sales dashboards and do not belong as headline KPIs. Calls made and emails sent are activity metrics; they tell you the team is busy, not whether deals close. Demos booked measures inbound interest, not qualified pipeline. Total leads in CRM measures how full the database is, not how productive it is. The honest replacements live one or two steps down the funnel: opportunities created, MQLs converted, win rate by source.
The full pattern (and the way to clean up a sales dashboard that has drifted into vanity) sits in our vanity metrics deep dive. The shortcut here: if a number can move 50% next quarter without revenue or pipeline being measurably better, it is vanity, not a KPI.
How to Set Up Your Sales Dashboard
The mechanics are straightforward; the discipline is in keeping the dashboard at six metrics. Five steps separate the sales teams that get value from KPI tracking from the ones that pile up half-watched dashboards.
Start with Sales Velocity as the headlineSales Velocity is the single number that compresses the engine's health into one signal. Calculate it weekly using your current pipeline volume, win rate, ASP, and cycle length. Everything else on the dashboard either feeds Velocity or explains why it moved.
Track the four inputs that move itPipeline coverage tells you whether the top of the funnel is healthy. Win rate tells you whether qualification is working. ASP tells you whether the team is closing the right deals. Cycle length tells you whether the process is efficient. Move any one of those and Velocity moves.
Add quota attainment and lead response timeQuota attainment is the board-level scorecard; track it monthly. Lead response time is the conversion-killer hidden in plain sight. The difference between responding in 5 minutes vs 30 minutes is a 5x to 21x conversion multiplier per published research; track it daily and alert when the team drifts.
Segment the win rateA blended company-wide win rate hides the truth. Split it by deal size (SMB / mid-market / enterprise), source (inbound / outbound / partner), and rep tenure. Each cut tells you whether to invest in better leads, better qualification, or better closing.
Pin the dashboard inside the workflowA KPI dashboard that lives in a CRM or BI tool gets opened twice a quarter. Pin the same six metrics inside the workspace where the team chats and ships, with a Monday review on the calendar. The closer the metrics are to the daily pipeline conversation, the more likely the team will move them.
"Winning large customers is much more about causing a sale, not just catching one." - Trish Bertuzzi, The Sales Development Playbook
Bertuzzi's distinction (causing vs catching) is why pipeline coverage and lead response time outrank passive metrics like total leads. Causing a sale means actively engineering the pipeline through targeted outbound, fast inbound response, and disciplined qualification. Catching a sale means waiting for inbound and hoping the close cycle does the rest. The six KPIs above are designed to track the causing, not the catching.
Common Mistakes
The patterns below show up across sales teams that intend to track KPIs well and quietly drift back to activity metrics or vanity. Most are political or process problems, not analytical ones.
Tracking activity instead of outcomeCalls made, demos booked, emails sent, and meetings held are activity metrics, not KPIs. They tell you the team is busy, not whether deals are closing. Track them as inputs to coach behavior; never as the headline metric the dashboard reports up.
Reporting a blended win rateA 22% company-wide win rate hides the truth. SMB might close at 35%, enterprise at 8%, and the average tells nobody what to do. Always segment by deal size, source, and rep before reporting; otherwise the metric drives no decision.
Letting pipeline coverage drift below 3xPipeline coverage is the leading indicator that runs ahead of quota. Below 3x, the team is mathematically unlikely to hit number this quarter, no matter how good closers are. Watch coverage weekly; treat any week below 2.5x as a fire drill, not a wait-and-see.
Ignoring lead response timeStudies show responding to inbound leads under 5 minutes vs 30 minutes is a 5 to 21x conversion multiplier. Most sales teams know this and still let response time drift to hours. Build the alert into the workflow; do not rely on willpower.
Tying compensation to revenue aloneCompensation tied solely to closed revenue creates short-cycle, deal-at-any-cost behavior. Margin gets sacrificed for the close; the wrong customers come in. The cleaner pattern: compensation tied to a blend of revenue and either gross margin or LTV-adjusted contribution.
No owner per KPIWhen pipeline coverage is "the team's responsibility" and win rate is "everyone's job," nobody fixes the trend on the day it slips. Each KPI needs a single named owner whose quarter rides on it. Shared ownership is the same as no ownership.
The biggest of these is the activity-as-KPI trap. Sales managers often track calls and demos because they are easy to count and feel like they correlate with results. They correlate weakly at best; what predicts revenue is qualified pipeline coverage and win rate by segment. Coach activity at the rep level; report outcomes at the dashboard level.
What We Recommend
At Rock we run sales teams on a pinned KPI note inside the same workspace where pipeline reviews and call recordings live, with deals tracked in Tasks and weekly reviews happening in team chat. The six KPIs sit at the top with their bands; below that, each KPI links to the deals and tasks that move it. Owners post one-line updates on Mondays for any KPI outside its band, and quarterly recalibration retires anything the team has not acted on.
The reason for keeping the dashboard inside the workspace where pipeline conversations happen is the same failure mode that hits marketing and agency teams. CRM dashboards open twice a quarter at the all-hands; KPI notes pinned next to the deal-by-deal Monday review stay visible, get debated, and actually drive action.
Pair this with the broader cluster and the six KPIs become the connective tissue between effort and revenue. The marketing KPIs piece covers what feeds the top of the funnel (LTV:CAC ratio is the marketing-side composite that mirrors Sales Velocity here). The agency KPIs spoke covers service-business numbers if your sales motion is consultative; billable hours sits below as the operational input layer. The KPI framework covers the discipline of what counts as a KPI; vanity metrics covers what to cut. The OKR vs KPI bridge and OKR framework cover when to drive change versus hold a standard. Above the dashboard layer, SWOT, Strategic Choice Cascade, and PESTEL set the strategic direction.
Track the six alongside the pipeline that produces them. Rock combines chat, tasks, and notes in one workspace. One flat price, unlimited users. Get started for free.


.jpeg)




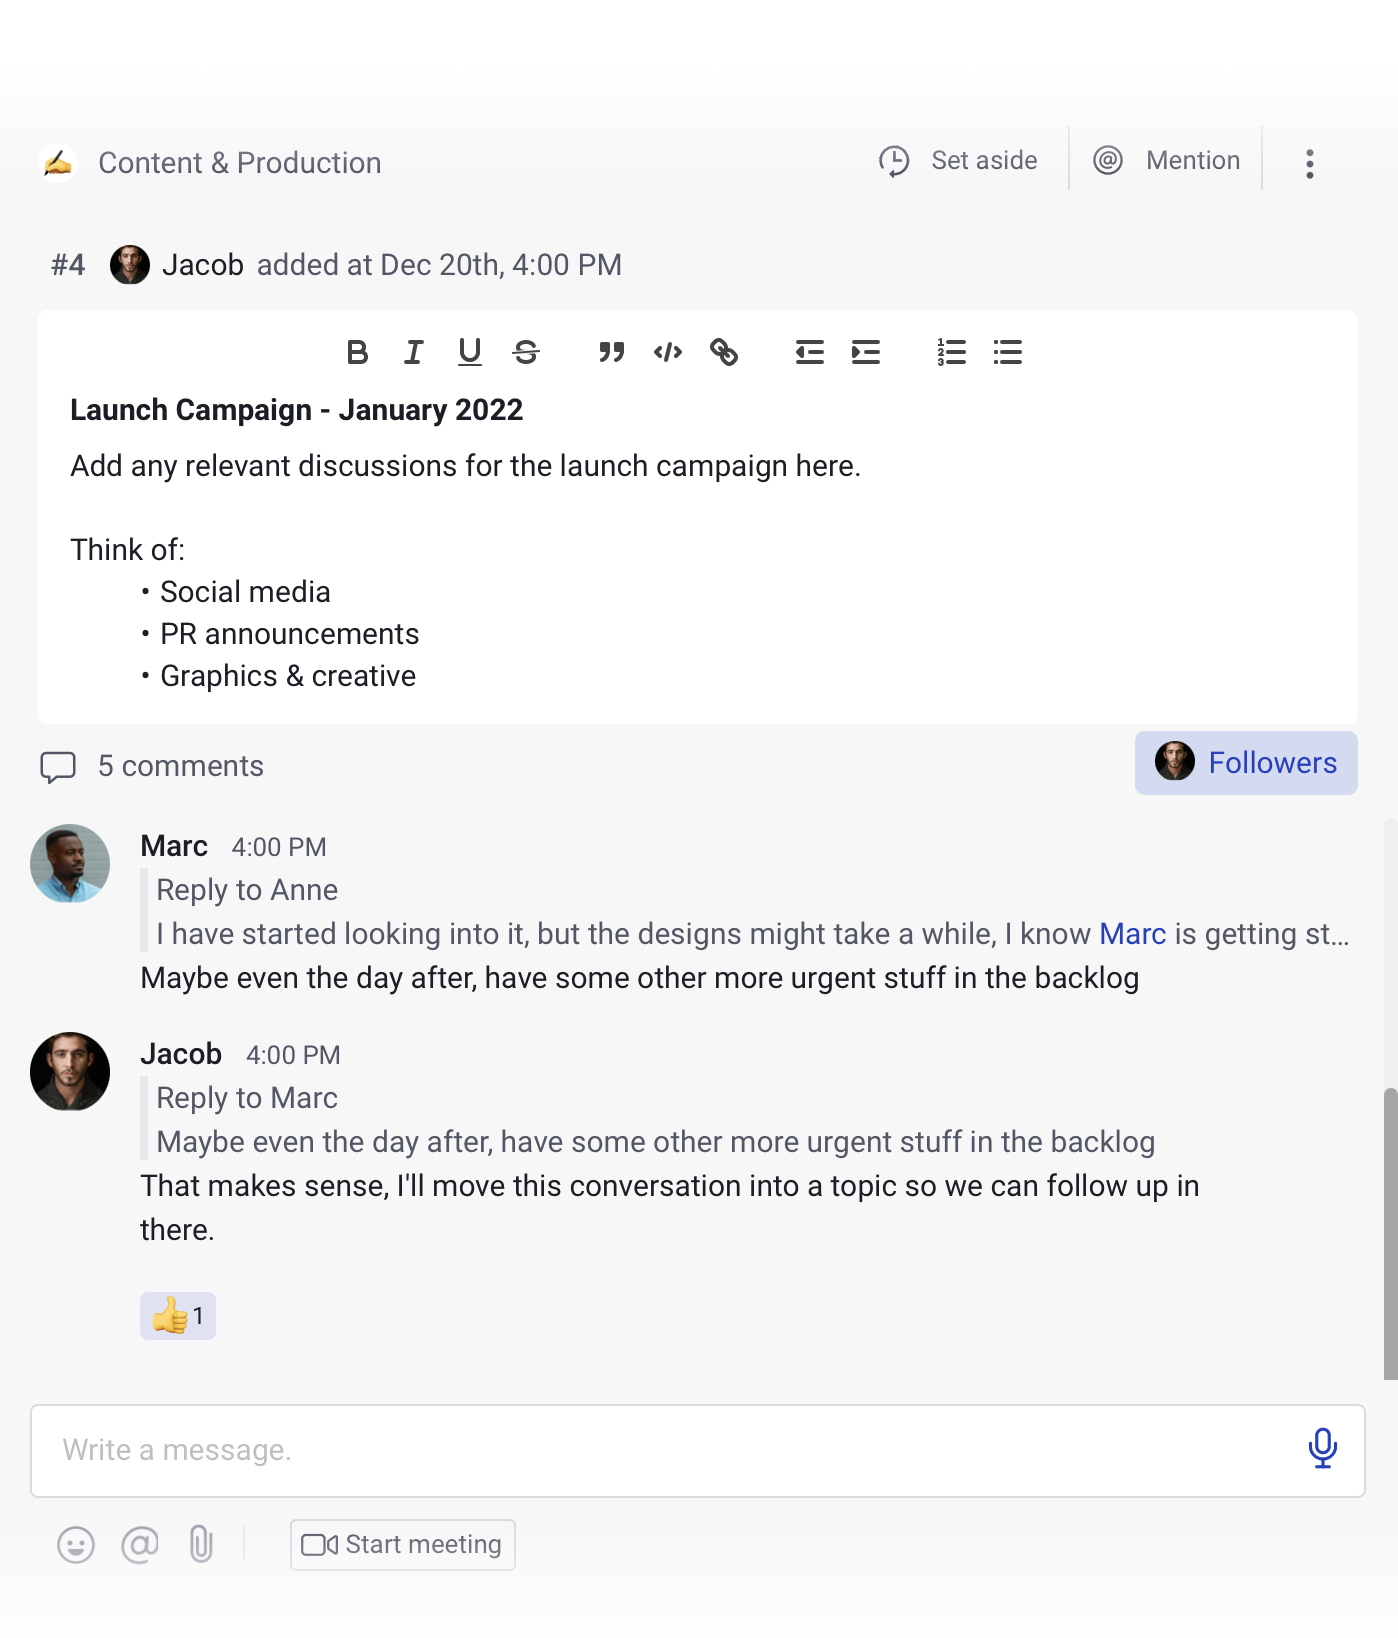
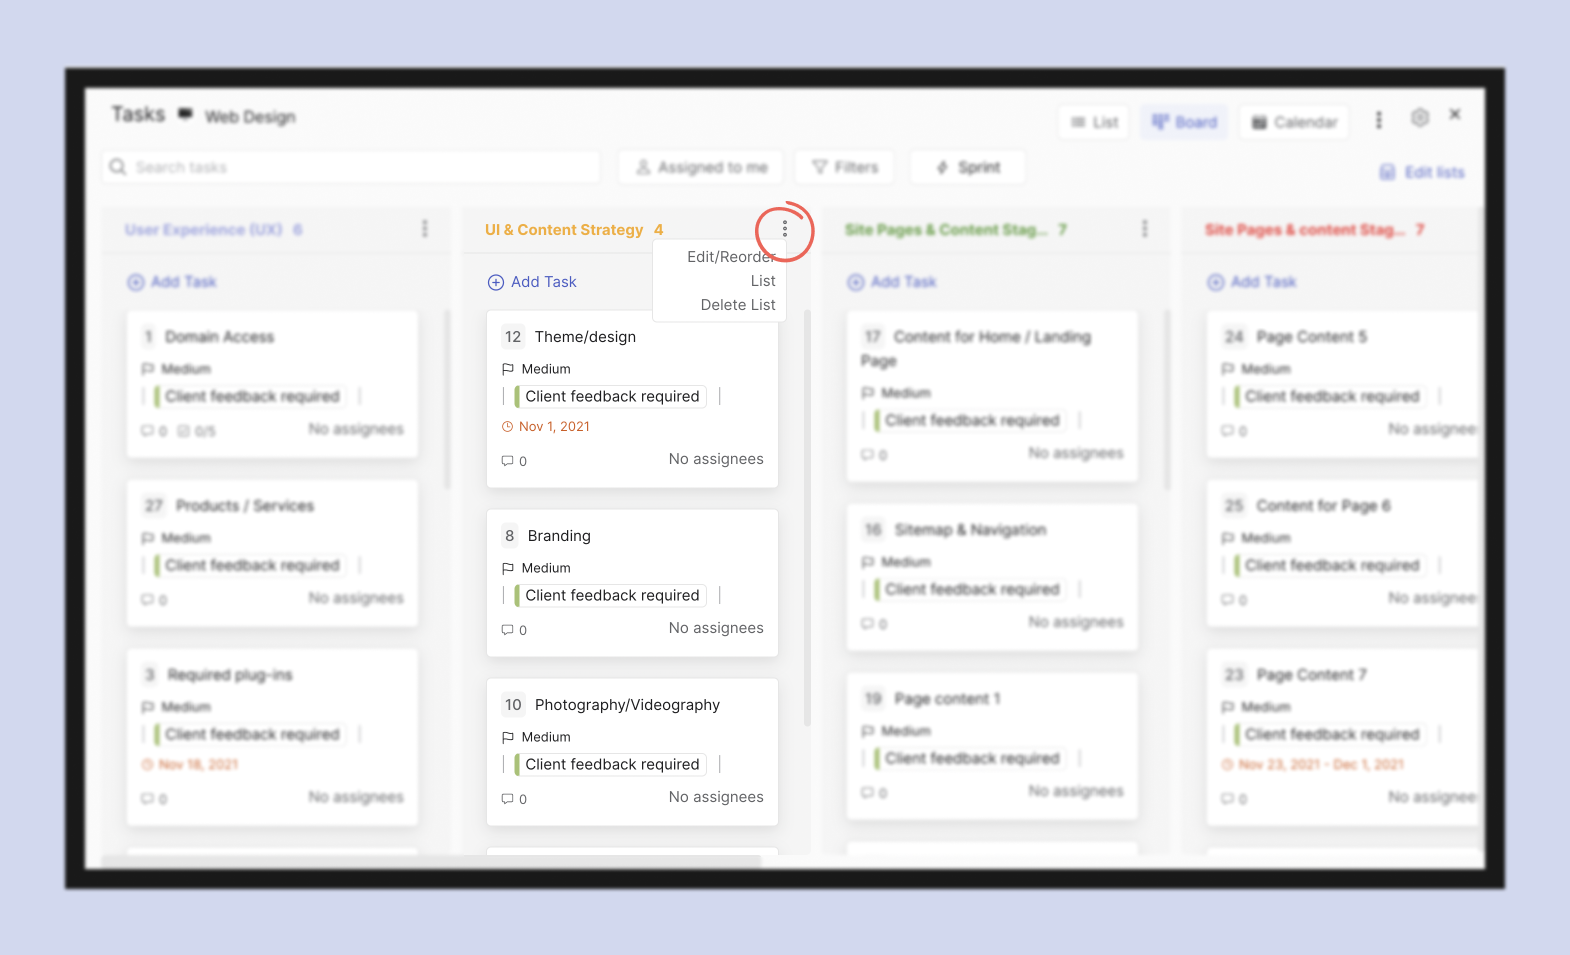
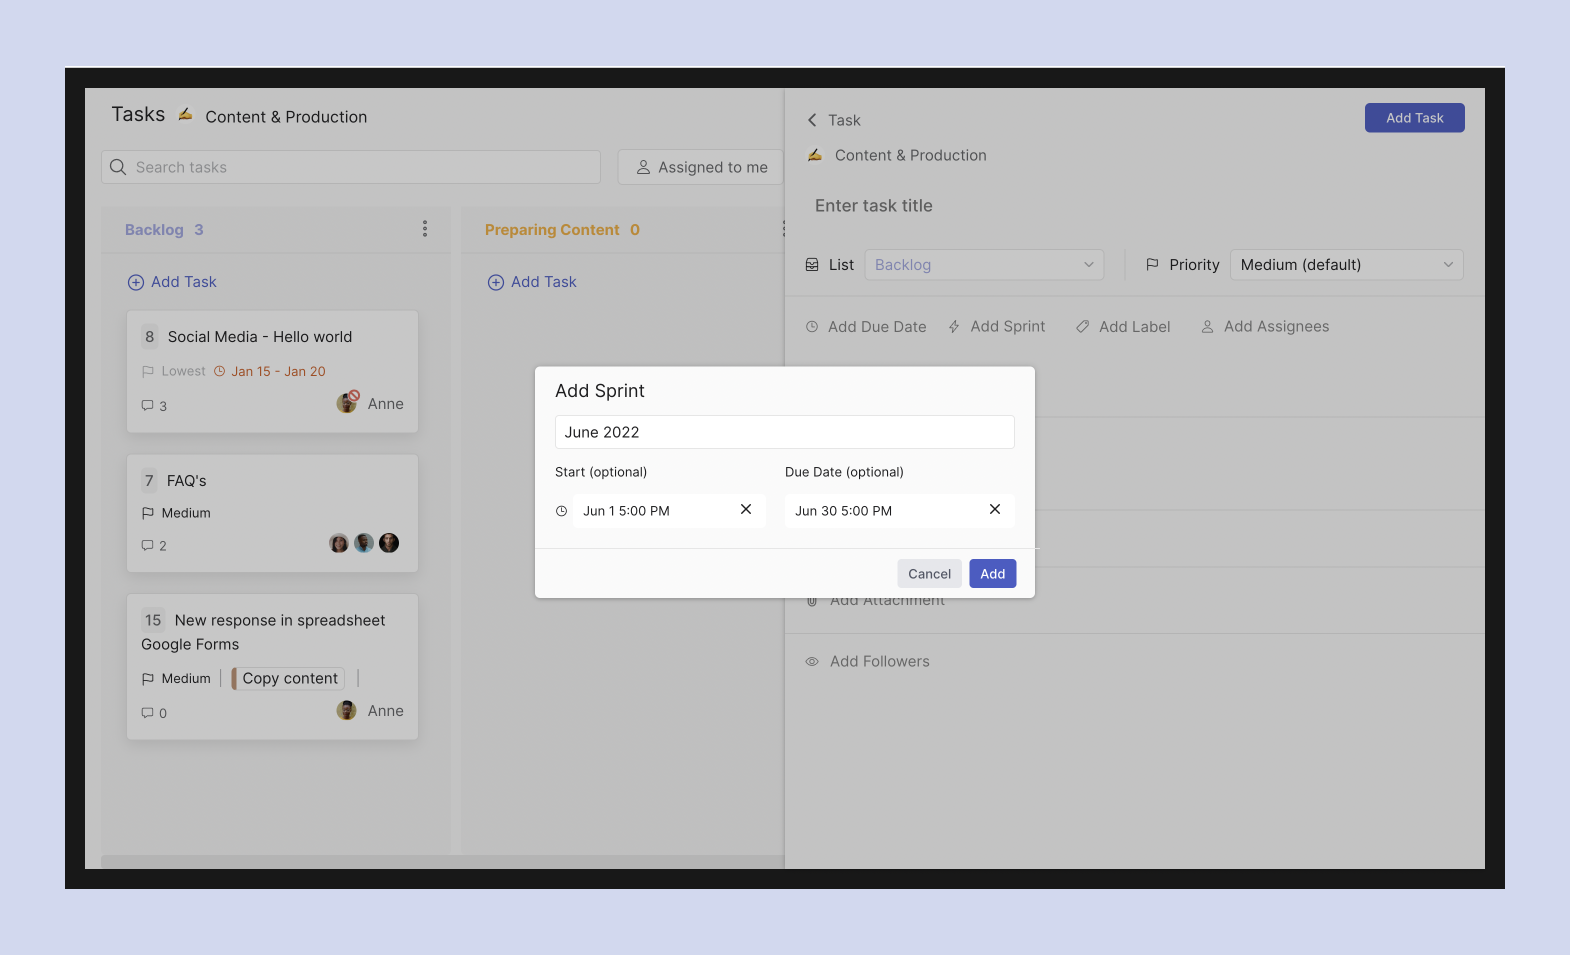
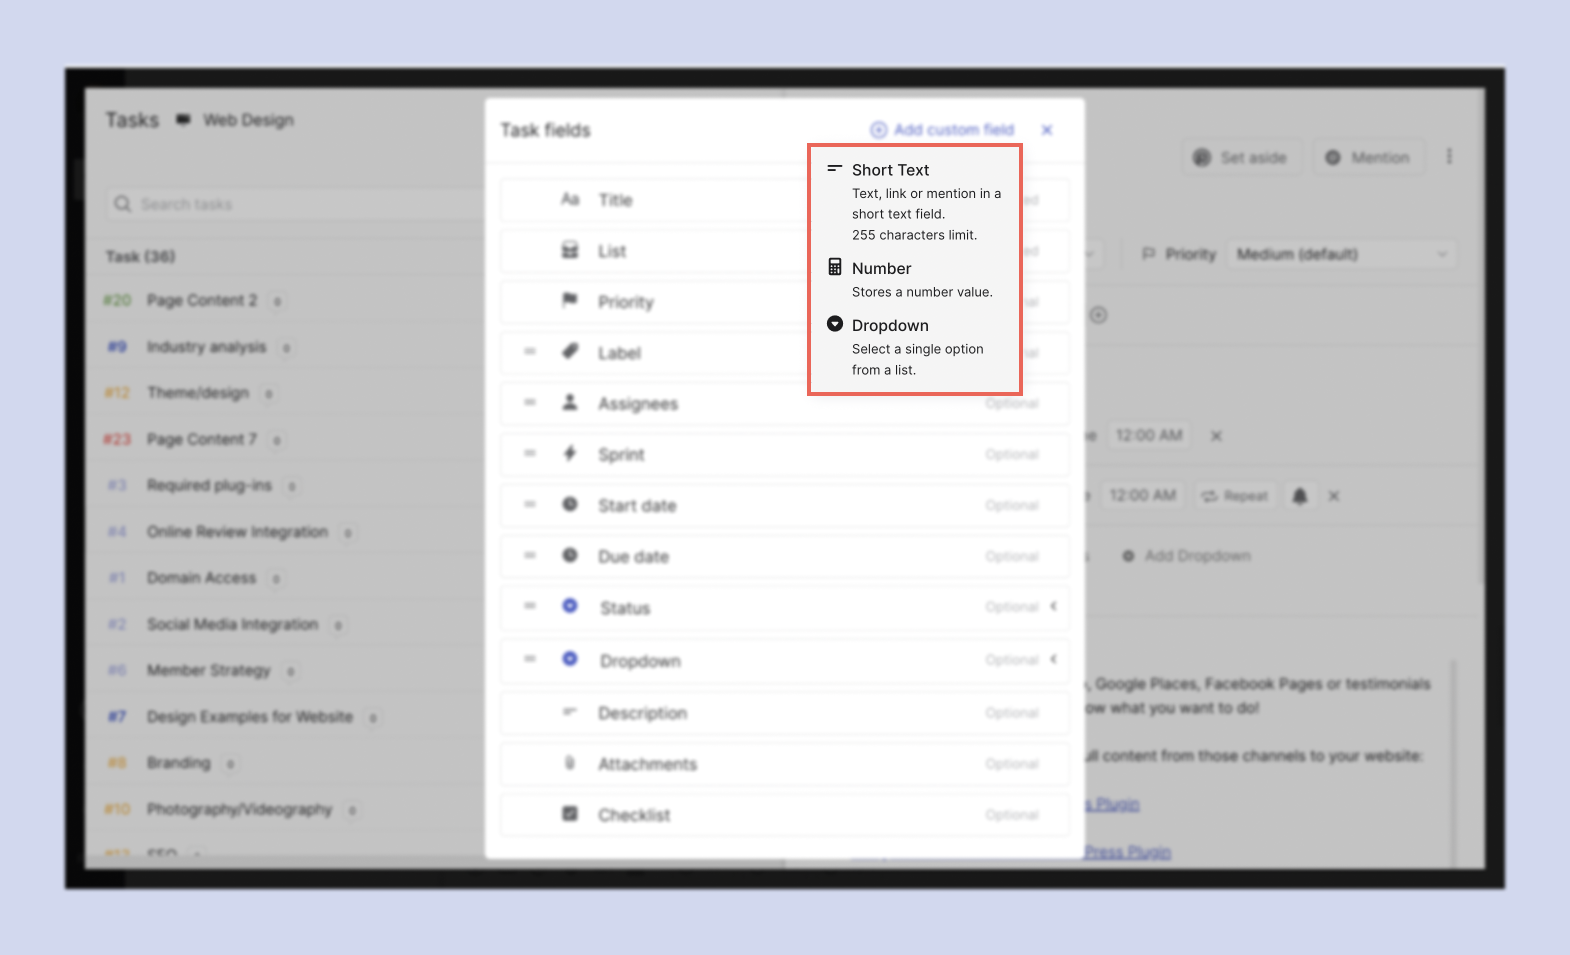
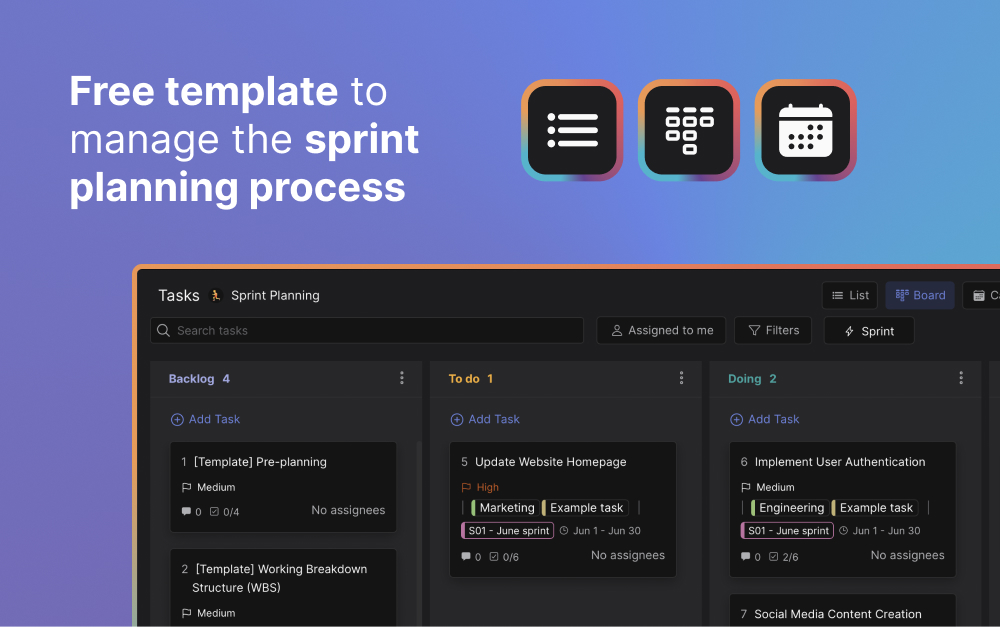


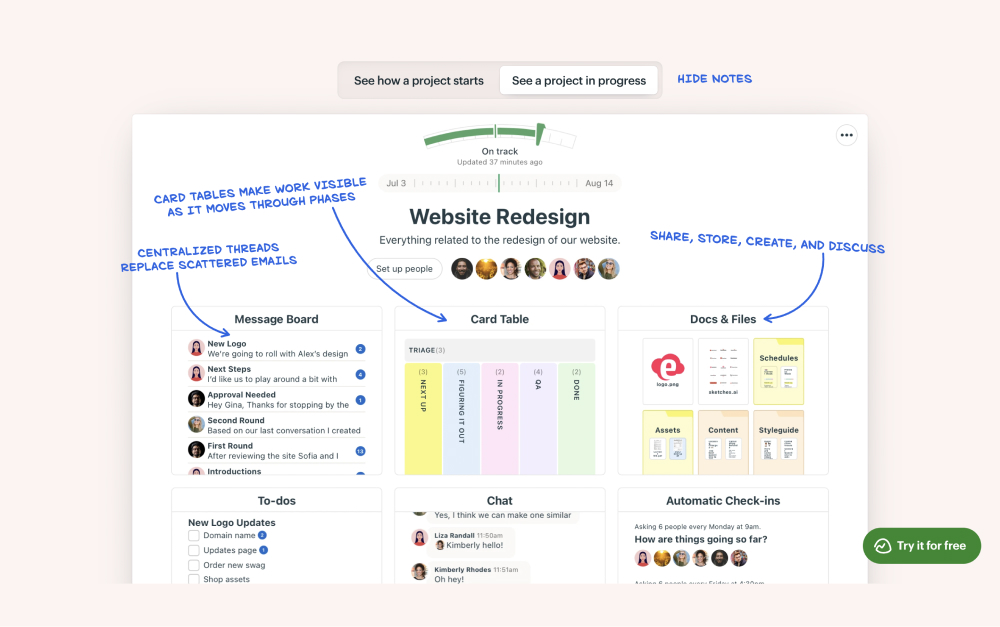
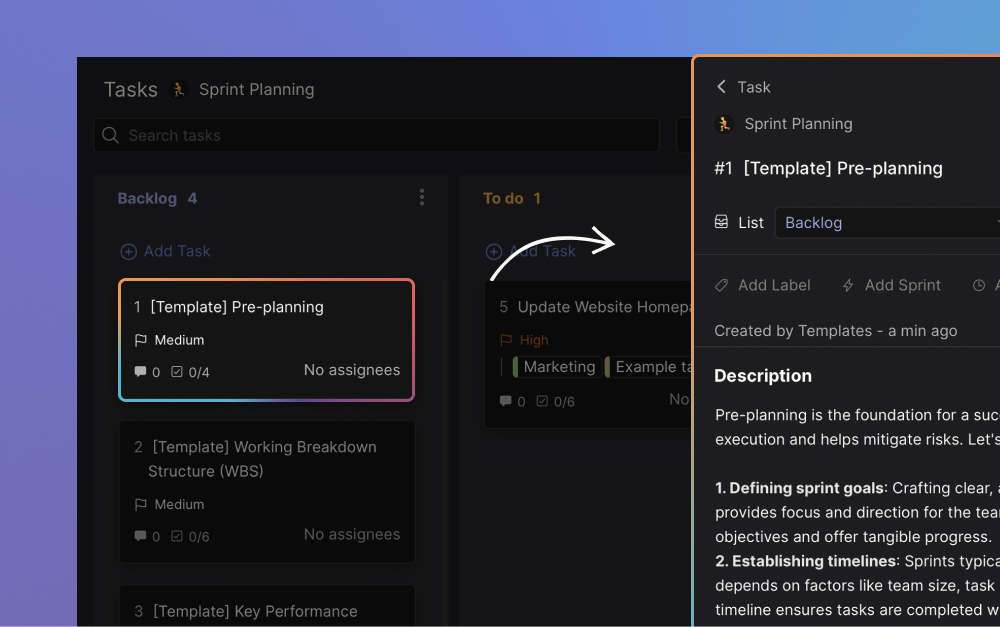
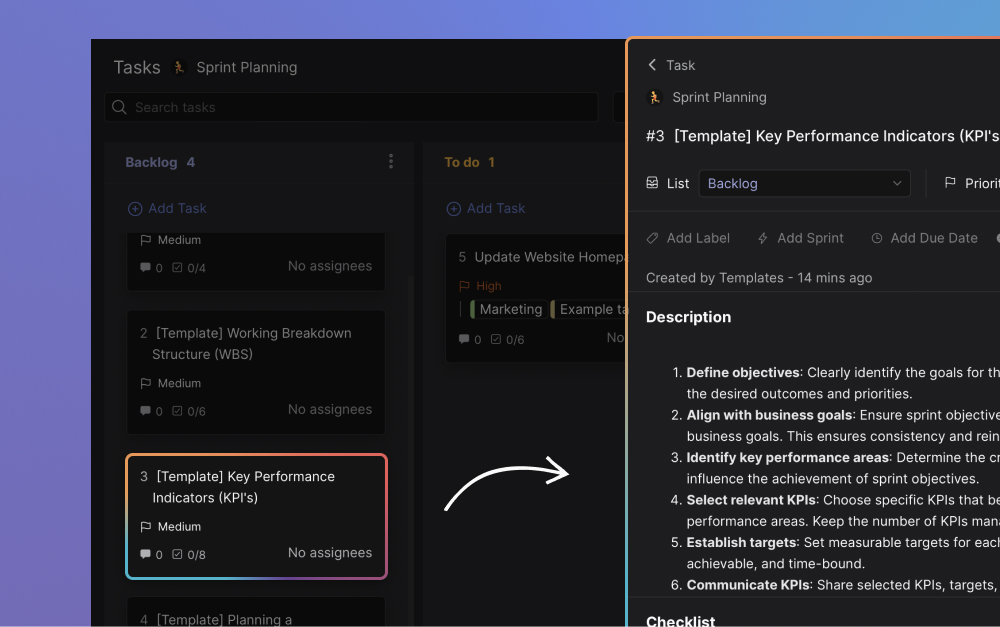


.jpeg)
.jpeg)